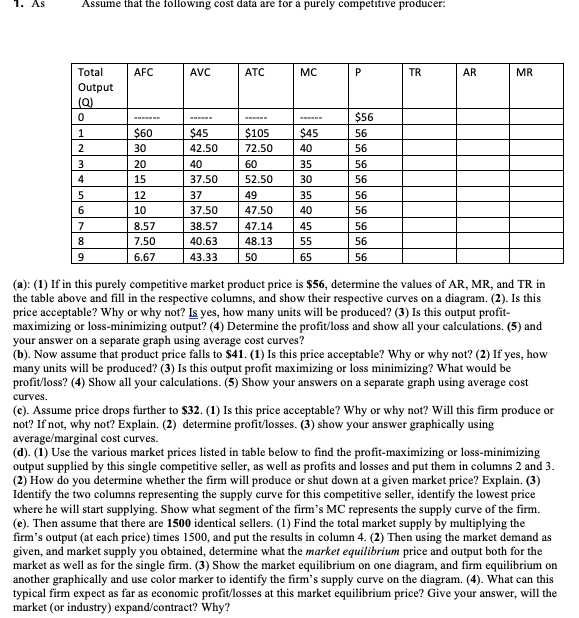
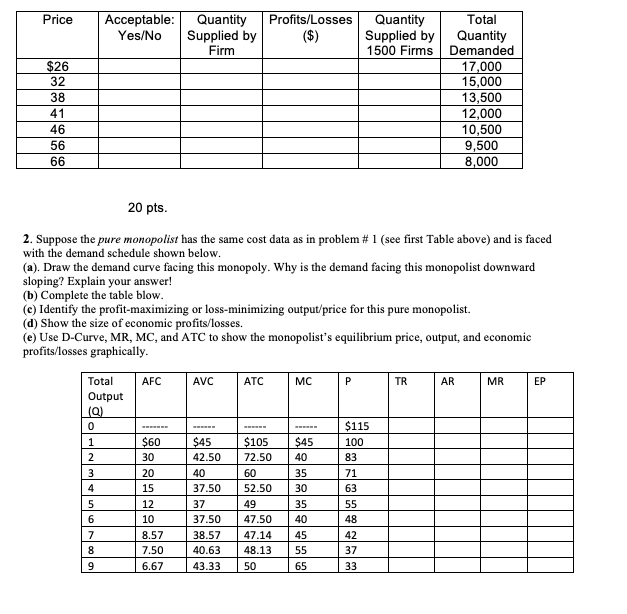
. AS Assume that the following cost data are for a purely competitive producer: Total AFC AVC ATC MC P TR AR MR Output 0 $56 1 $60 $45 $105 $45 56 2 30 42.50 72.50 40 56 3 20 40 60 35 56 4 15 37.50 52.50 30 56 5 12 37 49 35 56 6 10 37.50 47.50 40 56 7 8.57 38.57 47.14 45 56 8 7.50 40.63 48.13 55 56 9 6.67 43.33 50 65 56 (a): (1) If in this purely competitive market product price is $56, determine the values of AR, MR, and TR in the table above and fill in the respective columns, and show their respective curves on a diagram. (2). Is this price acceptable? Why or why not? Is yes, how many units will be produced? (3) Is this output profit- maximizing or loss-minimizing output? (4) Determine the profit/loss and show all your calculations. (5) and your answer on a separate graph using average cost curves? (b). Now assume that product price falls to $41. (1) Is this price acceptable? Why or why not? (2) If yes, how many units will be produced? (3) Is this output profit maximizing or loss minimizing? What would be profit/loss? (4) Show all your calculations. (5) Show your answers on a separate graph using average cost curves. (c). Assume price drops further to $32. (1) Is this price acceptable? Why or why not? Will this firm produce or not? If not, why not? Explain. (2) determine profit/losses. (3) show your answer graphically using average/marginal cost curves. (d). (1) Use the various market prices listed in table below to find the profit-maximizing or loss-minimizing output supplied by this single competitive seller, as well as profits and losses and put them in columns 2 and 3. (2) How do you determine whether the firm will produce or shut down at a given market price? Explain. (3) Identify the two columns representing the supply curve for this competitive seller, identify the lowest price where he will start supplying. Show what segment of the firm's MC represents the supply curve of the firm. (e). Then assume that there are 1500 identical sellers. (1) Find the total market supply by multiplying the firm's output (at each price) times 1500, and put the results in column 4. (2) Then using the market demand as given, and market supply you obtained, determine what the market equilibrium price and output both for the market as well as for the single firm. (3) Show the market equilibrium on one diagram, and firm equilibrium on another graphically and use color marker to identify the firm's supply curve on the diagram. (4). What can this typical firm expect as far as economic profit/losses at this market equilibrium price? Give your answer, will the market (or industry) expand/contract? Why?Price Acceptable: Quantity Profits/Losses Quantity Total Yes/No Supplied by ($) Supplied by Quantity Firm 1500 Firms Demanded $26 17,000 32 15,000 38 13,500 41 12,000 46 10,500 56 9,500 66 8,000 20 pts. 2. Suppose the pure monopolist has the same cost data as in problem # 1 (see first Table above) and is faced with the demand schedule shown below. (a). Draw the demand curve facing this monopoly. Why is the demand facing this monopolist downward sloping? Explain your answer! (b) Complete the table blow. (c) Identify the profit-maximizing or loss-minimizing output/price for this pure monopolist. (d) Show the size of economic profits/losses. (e) Use D-Curve, MR, MC, and ATC to show the monopolist's equilibrium price, output, and economic profits/losses graphically. Total AFC AVC ATC MC P TR AR MR EP Output (Q 0 $115 $60 $45 $105 $45 100 2 30 42.50 72.50 40 83 3 20 40 60 35 71 4 15 37.50 52.50 30 63 5 12 37 49 35 55 6 10 37.50 47.50 40 48 7 8.57 38.57 47.14 45 42 8 7.50 40.63 48.13 55 37 9 6.67 43.33 50 65 33