Answered step by step
Verified Expert Solution
Question
1 Approved Answer
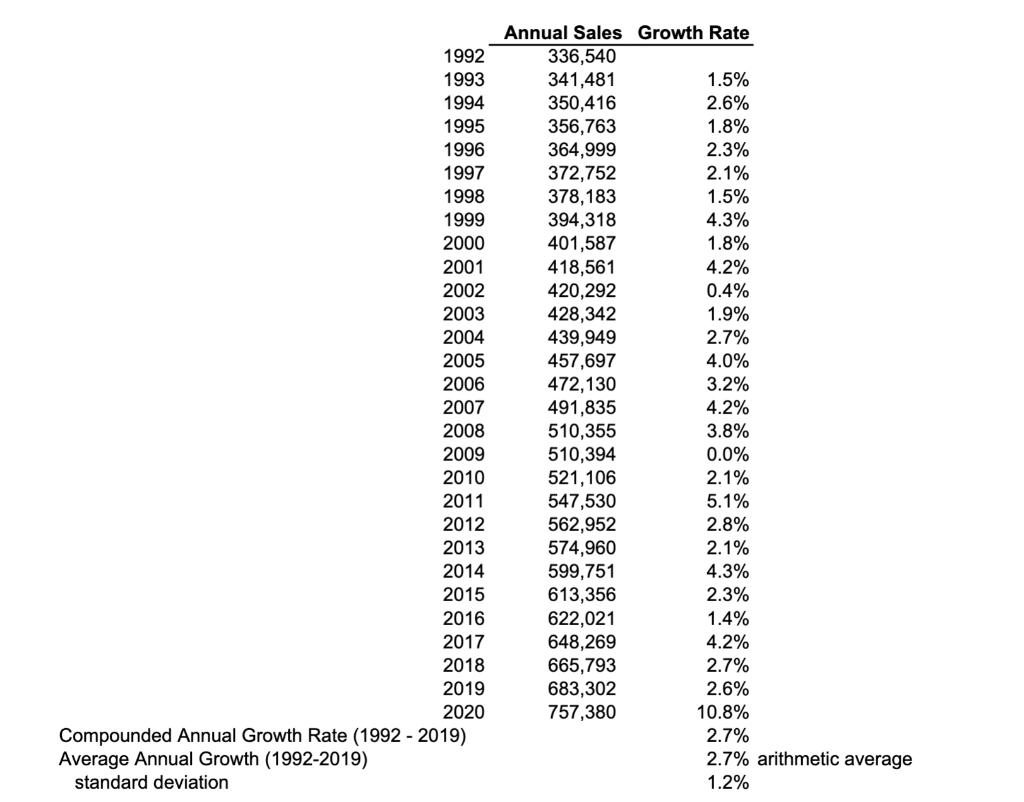
As shown in the St Louis Fed data report, industry revenue for the Supermarket Industry had a Compounded Annual Growth Rate from 1992 to


As shown in the St Louis Fed data report, industry revenue for the Supermarket Industry had a Compounded Annual Growth Rate from 1992 to 2019 of 2.7%. In 2020, industry revenue grew 10.8%. Provide some possible reasons that the historical growth rate for revenue was only 2.7% per year over the 28 year period shown Is it likely that the industry will now experience a much higher growth rate over the next 20 to 30 years? Provide your reasoning. 1992 1993 1994 1995 1996 1997 1998 1999 2000 2001 2002 2003 2004 2005 2006 2007 2008 2009 2010 2011 2012 2013 2014 2015 2016 2017 2018 2019 2020 Compounded Annual Growth Rate (1992-2019) Average Annual Growth (1992-2019) standard deviation Annual Sales Growth Rate 336,540 341,481 350,416 356,763 364,999 372,752 378,183 394,318 401,587 418,561 420,292 428,342 439,949 457,697 472,130 491,835 510,355 510,394 521,106 547,530 562,952 574,960 599,751 613,356 622,021 648,269 665,793 683,302 757,380 1.5% 2.6% 1.8% 2.3% 2.1% 1.5% 4.3% 1.8% 4.2% 0.4% 1.9% 2.7% 4.0% 3.2% 4.2% 3.8% 0.0% 2.1% 5.1% 2.8% 2.1% 4.3% 2.3% 1.4% 4.2% 2.7% 2.6% 10.8% 2.7% 2.7% arithmetic average 1.2%
Step by Step Solution
★★★★★
3.41 Rating (154 Votes )
There are 3 Steps involved in it
Step: 1
The detailed ...
Get Instant Access to Expert-Tailored Solutions
See step-by-step solutions with expert insights and AI powered tools for academic success
Step: 2

Step: 3

Ace Your Homework with AI
Get the answers you need in no time with our AI-driven, step-by-step assistance
Get Started


