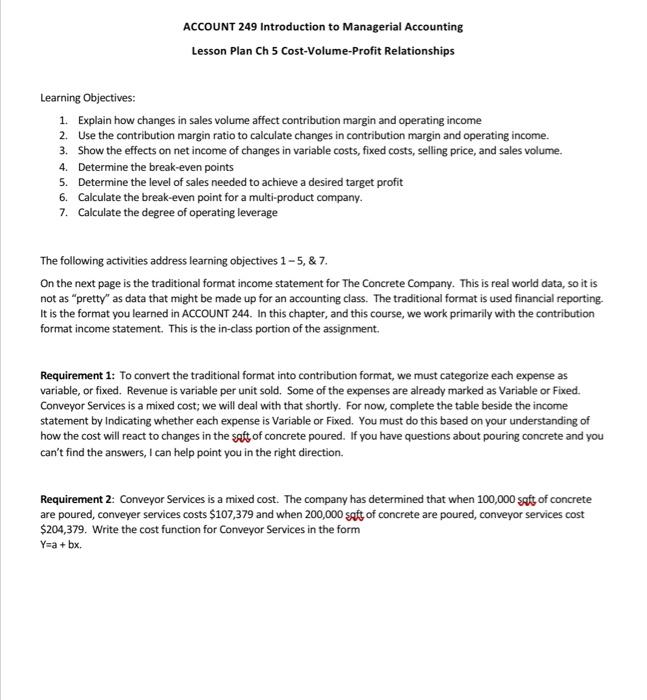
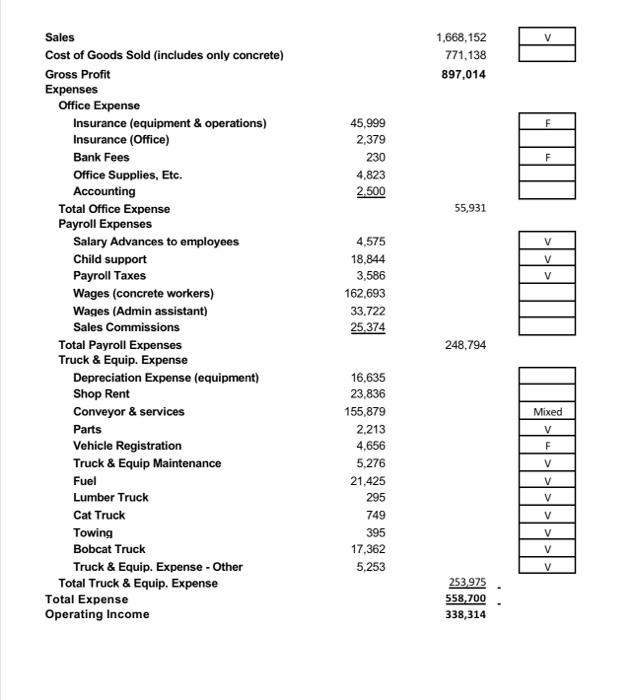
ACCOUNT 249 Introduction to Managerial Accounting Lesson Plan Ch 5 Cost-Volume-Profit Relationships Learning Objectives: 1. Explain how changes in sales volume affect contribution margin and operating income 2. Use the contribution margin ratio to calculate changes in contribution margin and operating income. 3. Show the effects on net income of changes in variable costs, fixed costs, selling price, and sales volume. 4. Determine the break-even points 5. Determine the level of sales needed to achieve a desired target profit 6. Calculate the break-even point for a multi-product company. 7. Calculate the degree of operating leverage The following activities address learning objectives 1-5,&7. On the next page is the traditional format income statement for The Concrete Company. This is real world data, so it is not as "pretty" as data that might be made up for an accounting class. The traditional format is used financial reporting It is the format you learned in ACCOUNT 244. In this chapter, and this course, we work primarily with the contribution format income statement. This is the in-class portion of the assignment. Requirement 1: To convert the traditional format into contribution format, we must categorize each expense as variable, or fixed. Revenue is variable per unit sold. Some of the expenses are already marked as Variable or Fixed. Conveyor Services is a mixed cost; we will deal with that shortly. For now, complete the table beside the income statement by Indicating whether each expense is Variable or Fixed. You must do this based on your understanding of how the cost will react to changes in the satt of concrete poured. If you have questions about pouring concrete and you can't find the answers, I can help point you in the right direction. Requirement 2: Conveyor Services is a mixed cost. The company has determined that when 100,000 saft of concrete are poured, conveyer services costs $107,379 and when 200,000 satt of concrete are poured, conveyor services cost $204,379. Write the cost function for Conveyor Services in the form Y=a + bx. V 1,668,152 771,138 897,014 45,999 2,379 230 4,823 2.500 F 55,931 V V V Sales Cost of Goods Sold (includes only concrete) Gross Profit Expenses Office Expense Insurance (equipment & operations) Insurance (Office) Bank Fees Office Supplies, Etc. Accounting Total Office Expense Payroll Expenses Salary Advances to employees Child support Payroll Taxes Wages (concrete workers) Wages (Admin assistant) Sales Commissions Total Payroll Expenses Truck & Equip. Expense Depreciation Expense (equipment) Shop Rent Conveyor & services Parts Vehicle Registration Truck & Equip Maintenance Fuel Lumber Truck Cat Truck Towing Bobcat Truck Truck & Equip. Expense - Other Total Truck & Equip. Expense Total Expense Operating Income 4,575 18,844 3,586 162,693 33,722 25,374 248.794 Mixed V F V 16,635 23,836 155,879 2.213 4,656 5,276 21,425 295 749 395 17,362 5,253 V V V V V V 253975 558,700 338,314


