Answered step by step
Verified Expert Solution
Link Copied!

Question

1 Approved Answer

Asset prices: 2014-55.9 2015-56.9 2016-54.9 2017-56.0 2018-56.1 2019-57.1 2020-55.2 2021-56.0 Question-1: Some asset price data has been assigned to your name (see appendix). Input the

Asset prices:

2014-55.9

2015-56.9

2016-54.9

2017-56.0

2018-56.1

2019-57.1

2020-55.2

2021-56.0image text in transcribed

Question-1: Some asset price data has been assigned to your name (see appendix). Input the price data in the following table. a) calculate the return for the years, 2015, 2016, 2017, 2018, 2019, 2020, 2021. 2 Return (%) Price (Tk) 10 12 Year 2014 2015 2016 2017 2018 2019 2020 2021 Market Index 4219 4833 4518 5440 5309 5411 3956 6220 [For example- consider 2014 price (Tk 10) as beginning price and 2015 price (Tk 12) as ending price. Then calculate - Return (2015)= (2015 Price- 2014 Price)/2014 price = (12-10)/10 = 0.02 or 2% Likewise do the same for other years (2016, 2017, 2018, 2019, 2020, 2021). Return on 2014 will remain empty] b) Calculate average return, standard deviation, and semi-deviation from the returns of 2015- 2021. 8

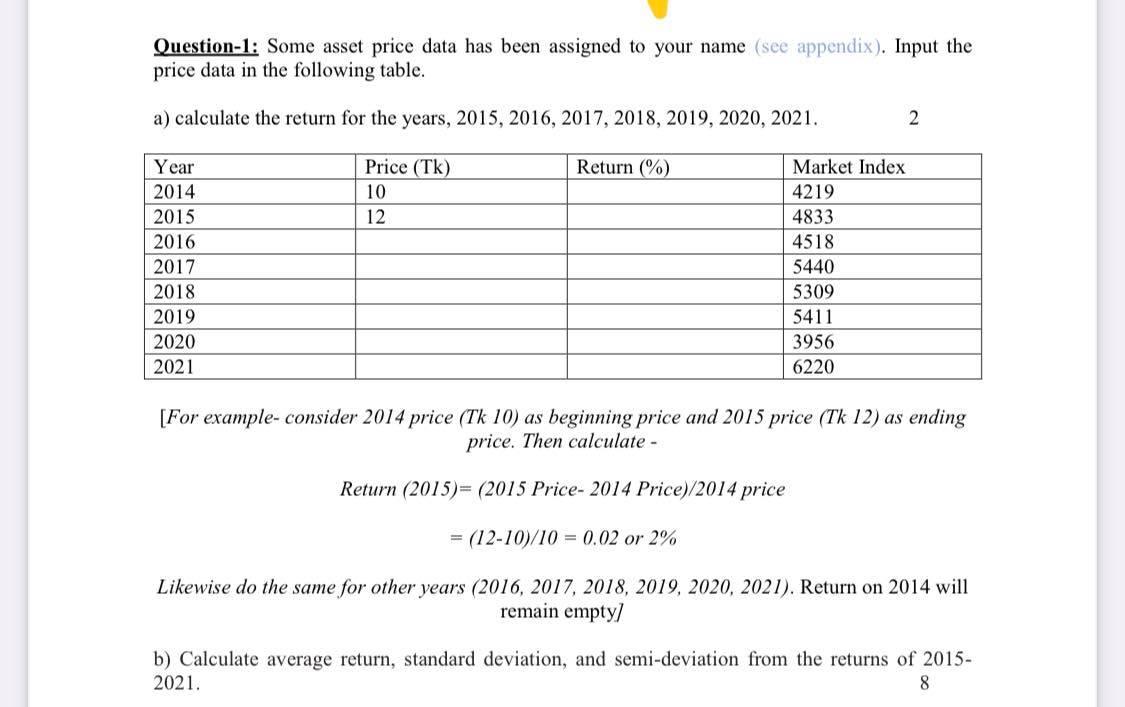
Step by Step Solution

There are 3 Steps involved in it

Step: 1

blur-text-image

Get Instant Access to Expert-Tailored Solutions

See step-by-step solutions with expert insights and AI powered tools for academic success

Step: 2

blur-text-image

Step: 3

blur-text-image

Ace Your Homework with AI

Get the answers you need in no time with our AI-driven, step-by-step assistance

Get Started

Recommended Textbook for

Financial statements

Authors: Stephen Barrad

5th Edition

978-007802531, 9780324186383, 032418638X

More Books

Students also viewed these Finance questions

Question

The need, sometimes, to reposition the organization (Chapter 4).

Answered: 1 week ago

Question

What are the determinants of cash cycle ? Explain

Answered: 1 week ago