Answered step by step
Verified Expert Solution
Link Copied!

Question

1 Approved Answer

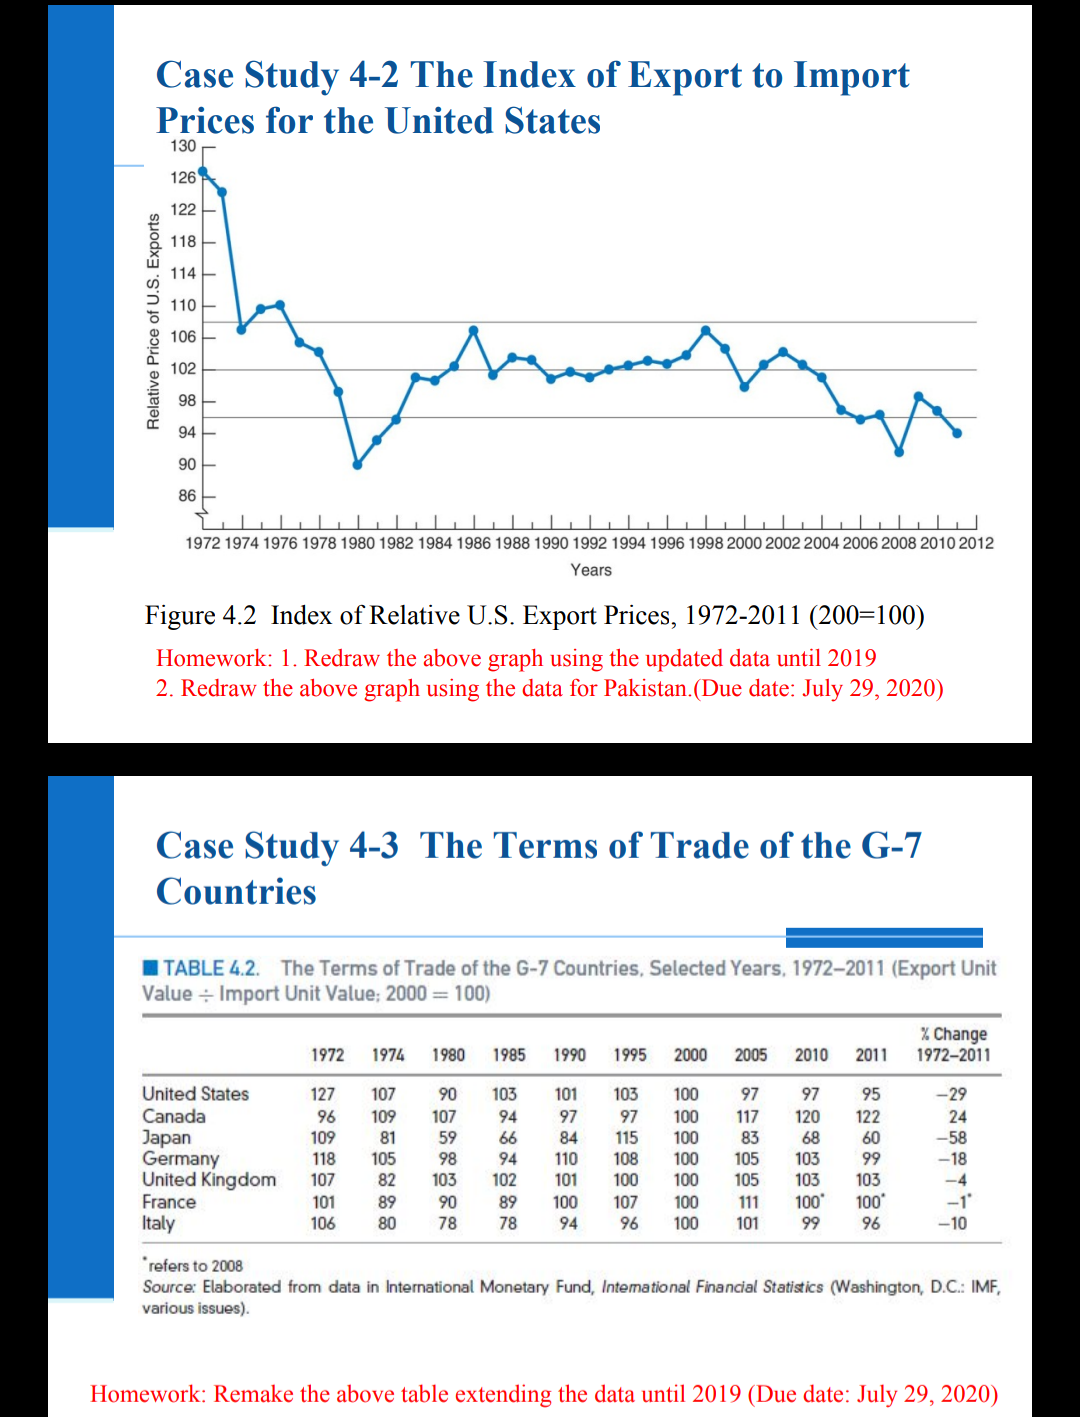
Assignment: Case Study 4-2 The Index of Export to Import Prices for the United States 130 126 Relative Price of U.S. Exports 122 8 8

Assignment:

image text in transcribedimage text in transcribedimage text in transcribed
Case Study 4-2 The Index of Export to Import Prices for the United States 130 126 Relative Price of U.S. Exports 122 8 8 8 8 8 8 3 3 2 T 1972 1974 1976 1978 1980 1982 1984 1986 1988 1990 1992 1994 1996 1998 2000 2002 2004 2006 2008 2010 2012 Years Figure 4.2 Index of Relative U.S. Export Prices, 1972-2011 (200=100) Homework: 1. Redraw the above graph using the updated data until 2019 2. Redraw the above graph using the data for Pakistan.(Due date: July 29, 2020) Case Study 4-3 The Terms of Trade of the G-7 Countries TABLE 4.2. The Terms of Trade of the G-7 Countries, Selected Years, 1972-2011 (Export Unit Value + Import Unit Value; 2000 = 100) % Change 1972 1974 1980 1985 1990 1995 2000 2005 2010 2011 1972-2011 United States 127 107 90 103 101 103 100 97 97 95 -29 Canada 96 109 107 94 97 97 100 117 120 122 24 Japan 109 81 59 66 84 115 100 83 68 60 -58 Germany 118 105 98 94 110 108 100 105 103 99 -18 United Kingdom 107 82 103 102 101 100 100 105 103 103 France 101 89 90 89 100 107 100 111 100' 100' -1' Italy 106 80 78 78 94 96 100 101 99 96 -10 "refers to 2008 Source: Elaborated from data in International Monetary Fund, International Financial Statistics (Washington, D.C.: IMF, various issues) Homework: Remake the above table extending the data until 2019 (Due date: July 29, 2020)Case Study 4-4 The Terms of Advanced and Developing Countries TABLE 4.3. The Terms of Trade of Advanced and Developing Countries, Selected Years. 1972-2010 (Export Unit Value : Import Unit Value; 2000 = 100) 1972 1974 1980 1985 1990 1995 2000 2005 2010 Industrial countries 110 97 89 Developing countries 87 100 105 100 101 61 98 86 107 101 Africa 103 102 100 99 102 85 118 117 115 Asia 100 103 100 108 101 101 101 98 Europe 103 107 100 92 112 104 101 69 64 Middle East 69 106 100 102 95 94 75 90 80 Western Hemisphere 109 68 100 39 140 110 194 167' 189 130 107 100 104 92 "refers to 2007 Source: International Monetary Fund, International Financial Statistics (Washington, D.C.: IMF, various issues).Homework: 1. Redraw the graph 4.2 using the updated data until 2019 2. Redraw the graph4.2 using the data for Pakistan. (Due date: July 29, 2020). 3. Remake the table 4.3 extending the data until 2019 (Due date: July 29, 2020)

Step by Step Solution

There are 3 Steps involved in it

Step: 1

blur-text-image

Get Instant Access to Expert-Tailored Solutions

See step-by-step solutions with expert insights and AI powered tools for academic success

Step: 2

blur-text-image

Step: 3

blur-text-image

Ace Your Homework with AI

Get the answers you need in no time with our AI-driven, step-by-step assistance

Get Started

Recommended Textbook for

Advanced Placement Microeconomics

Authors: Bill Hurd

1st Edition

1531150306, 978-1531150303

More Books

Students also viewed these Economics questions

Question

3. Where are goods and services produced?

Answered: 1 week ago