

Answered step by step
Verified Expert Solution
Question
1 Approved Answer
Assume stock price follows the geometric Brownian motion SdS=dt+dZ The form above has a discrete-time version SS=t+t where the random variable has a standard normal
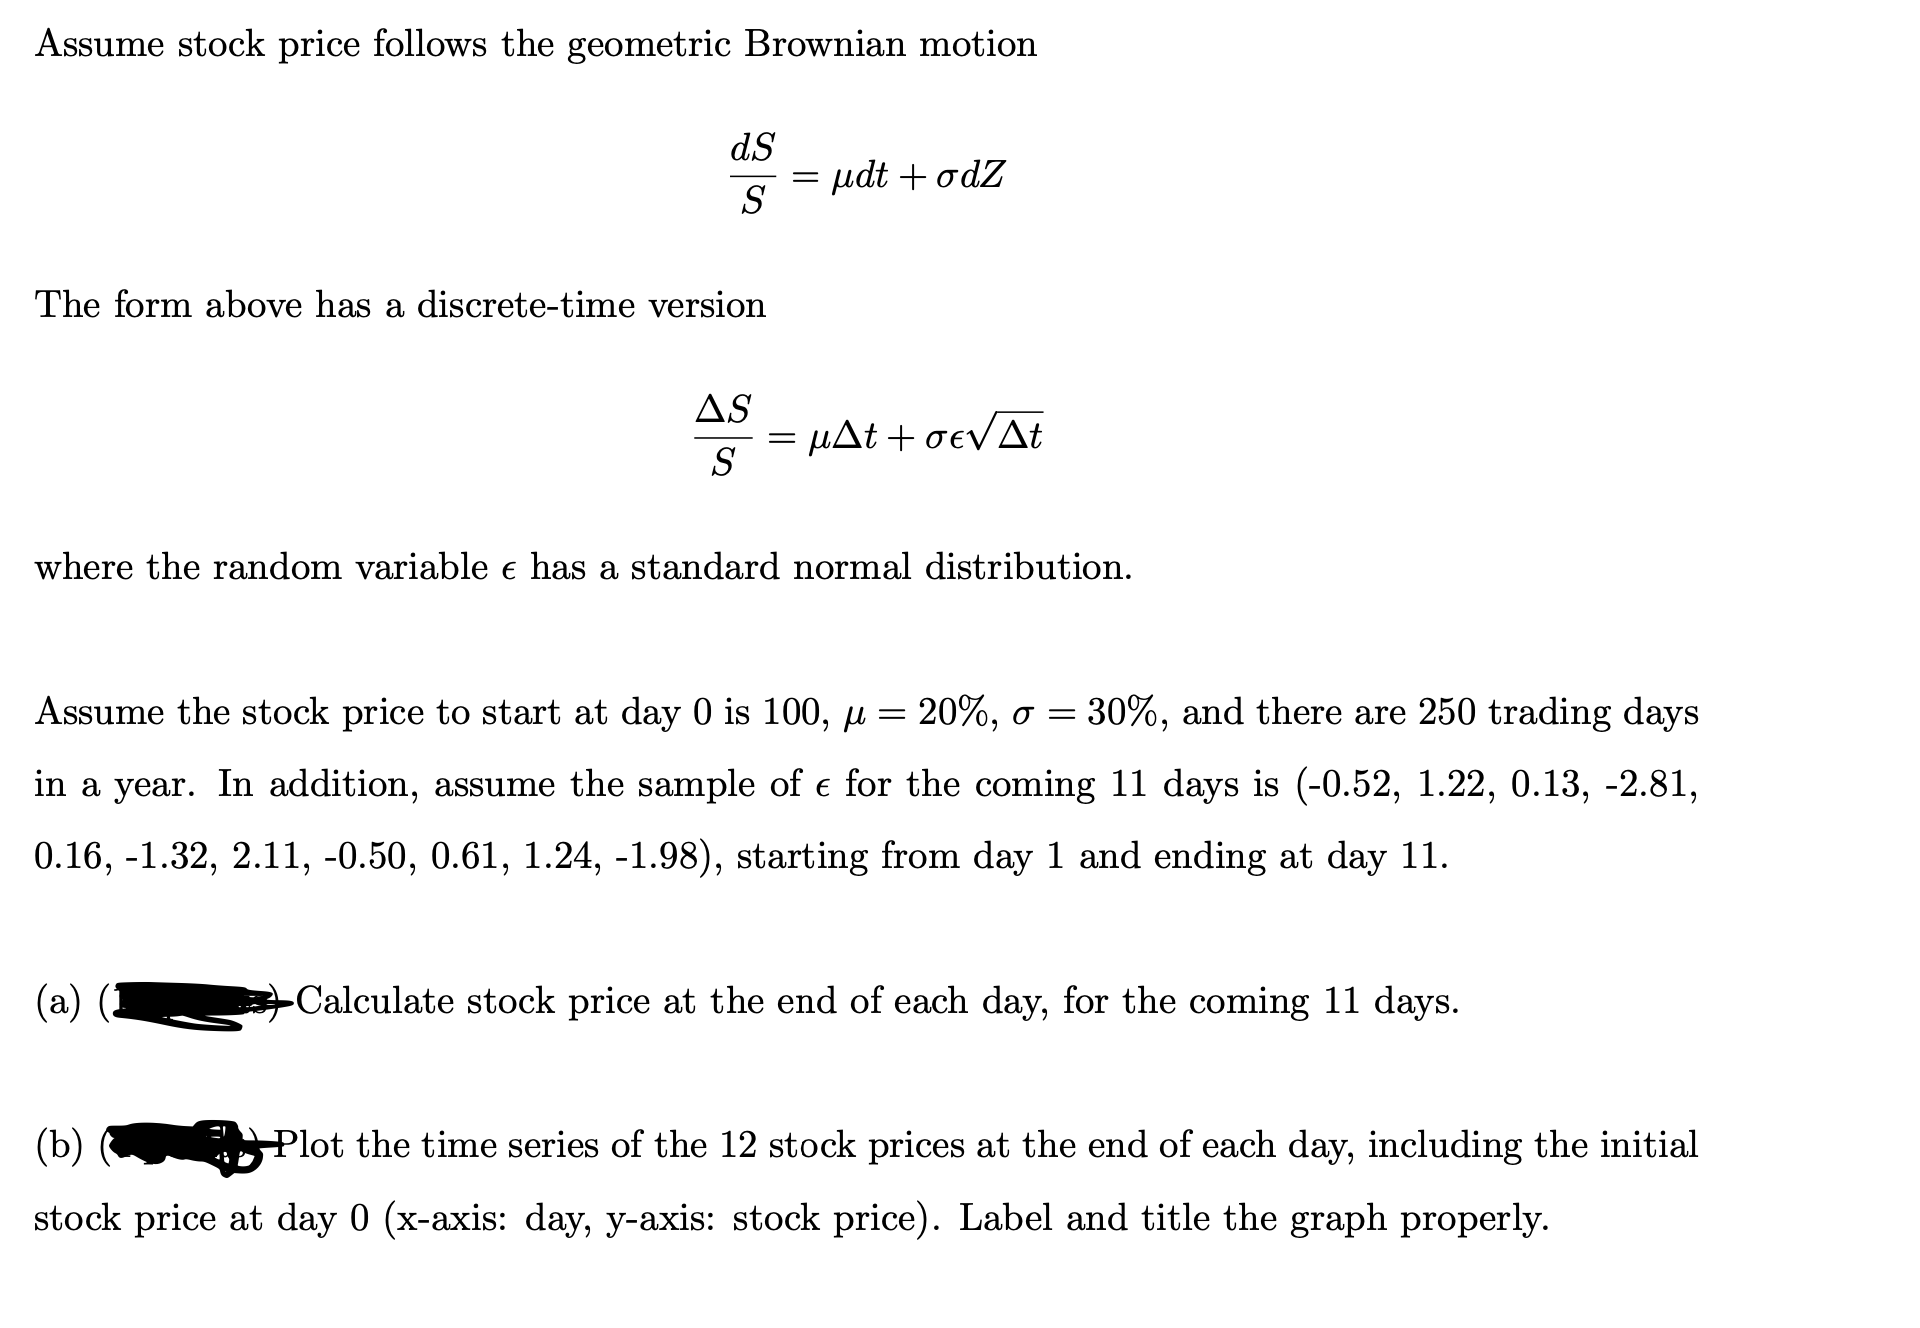 Assume stock price follows the geometric Brownian motion SdS=dt+dZ The form above has a discrete-time version SS=t+t where the random variable has a standard normal distribution. Assume the stock price to start at day 0 is 100,=20%,=30%, and there are 250 trading days in a year. In addition, assume the sample of for the coming 11 days is (0.52,1.22,0.13,2.81, 0.16,1.32,2.11,0.50,0.61,1.24,1.98), starting from day 1 and ending at day 11 . (a) Calculate stock price at the end of each day, for the coming 11 days. (b) Calculatestockpriceattheendofeachday,forthecoming11days. stock price at day 0 (x-axis: day, y-axis: stock price). Label and title the graph properly
 Step by Step Solution
There are 3 Steps involved in it
Step: 1

Get Instant Access to Expert-Tailored Solutions
See step-by-step solutions with expert insights and AI powered tools for academic success
Step: 2

Step: 3
Ace Your Homework with AI
Get the answers you need in no time with our AI-driven, step-by-step assistance
Get Started
Investments
Authors: Zvi Bodie, Alex Kane, Alan Marcus, Stylianos Perrakis, Peter
8th Canadian Edition
007133887X, 978-0071338875