Answered step by step
Verified Expert Solution
Link Copied!

Question

1 Approved Answer

Assume that the continuously-compounded spot yield curve is as follows: r(0,0.5) = 1.2%, r(0,1) = 1.6%, r(0,1.5) = 2%, r(0,2) = 2.2%. . Fit the
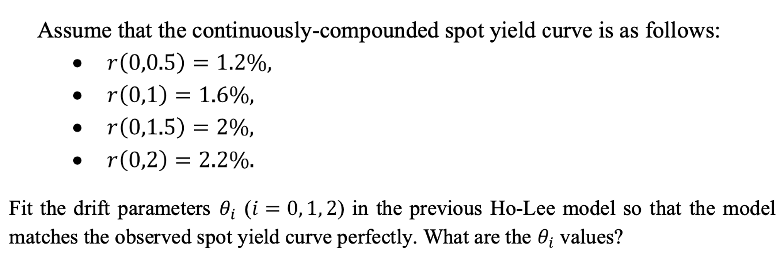
image text in transcribed

Assume that the continuously-compounded spot yield curve is as follows: r(0,0.5) = 1.2%, r(0,1) = 1.6%, r(0,1.5) = 2%, r(0,2) = 2.2%. . Fit the drift parameters @i (i = 0,1,2) in the previous Ho-Lee model so that the model matches the observed spot yield curve perfectly. What are the O values? Assume that the continuously-compounded spot yield curve is as follows: r(0,0.5) = 1.2%, r(0,1) = 1.6%, r(0,1.5) = 2%, r(0,2) = 2.2%. . Fit the drift parameters @i (i = 0,1,2) in the previous Ho-Lee model so that the model matches the observed spot yield curve perfectly. What are the O values

Step by Step Solution

There are 3 Steps involved in it

Step: 1

blur-text-image

Get Instant Access to Expert-Tailored Solutions

See step-by-step solutions with expert insights and AI powered tools for academic success

Step: 2

blur-text-image_2

Step: 3

blur-text-image_3

Ace Your Homework with AI

Get the answers you need in no time with our AI-driven, step-by-step assistance

Get Started

Recommended Textbook for

Financial Informatics An Information Based Approach To Asset Pricing

Authors: Dorje C Brody, Lane Palmer Hughston, Andrea Macrina

1st Edition

9811246483, 978-9811246487

More Books

Students also viewed these Finance questions

Question

What are the differences among the time-series methods?

Answered: 1 week ago