

Question
Assume that the population of all sister-brother heights has a bivariate normal distribution and that the data in Table 14.4 were sampled from this distribution.
Assume that the population of all sister-brother heights has a bivariate normal distribution and that the data in Table 14.4 were sampled from this distribution.
(a)Compute the sample coefficient of determination, the proportion of variation "explained" by simple linear regression.
(b)Let . Do these data provide convincing evidence that knowing a sister's height helps one predict her brother's height ?
(c)Construct a 0.90-level confidence interval for the slope of the population regression line for predicting from .
(d)Suppose that you are planning to conduct a more comprehensive study of sibling heights. Your goal is to better estimate the slope of the population regression line for predicting from . If you want to construct a 0.95-level confidence interval of length 0.1, then how many sister-brother pairs should you plan to observe?
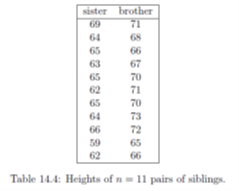 sister brother Table 14.4: Heights of n = 11 pairs of siblings
 Step by Step Solution
There are 3 Steps involved in it
Step: 1

Get Instant Access to Expert-Tailored Solutions
See step-by-step solutions with expert insights and AI powered tools for academic success
Step: 2

Step: 3
Ace Your Homework with AI
Get the answers you need in no time with our AI-driven, step-by-step assistance
Get Started
Birds Higher Engineering Mathematics
Authors: John Bird
9th Edition
1000353036, 9781000353037