Answered step by step
Verified Expert Solution
Question
1 Approved Answer
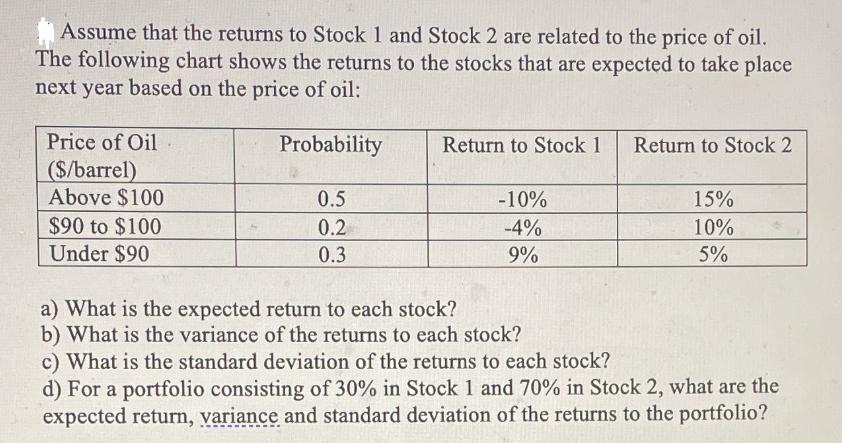
Assume that the returns to Stock 1 and Stock 2 are related to the price of oil. The following chart shows the returns to

Assume that the returns to Stock 1 and Stock 2 are related to the price of oil. The following chart shows the returns to the stocks that are expected to take place next year based on the price of oil: Price of Oil ($/barrel) Above $100 $90 to $100 Under $90 Probability 0.5 0.2 0.3 Return to Stock 1 -10% -4% 9% a) What is the expected return to each stock? b) What is the variance of the returns to each stock? Return to Stock 2 15% 10% 5% c) What is the standard deviation of the returns to each stock? d) For a portfolio consisting of 30% in Stock 1 and 70% in Stock 2, what are the expected return, variance and standard deviation of the returns to the portfolio?
Step by Step Solution
★★★★★
3.42 Rating (149 Votes )
There are 3 Steps involved in it
Step: 1
a The expected return for Stock 1 is calculated as Expected return of Stock 1 probability of return above 100 return above 100 probability of return between 90 and 100 return between 90 and 100 probab...
Get Instant Access to Expert-Tailored Solutions
See step-by-step solutions with expert insights and AI powered tools for academic success
Step: 2

Step: 3

Ace Your Homework with AI
Get the answers you need in no time with our AI-driven, step-by-step assistance
Get Started


