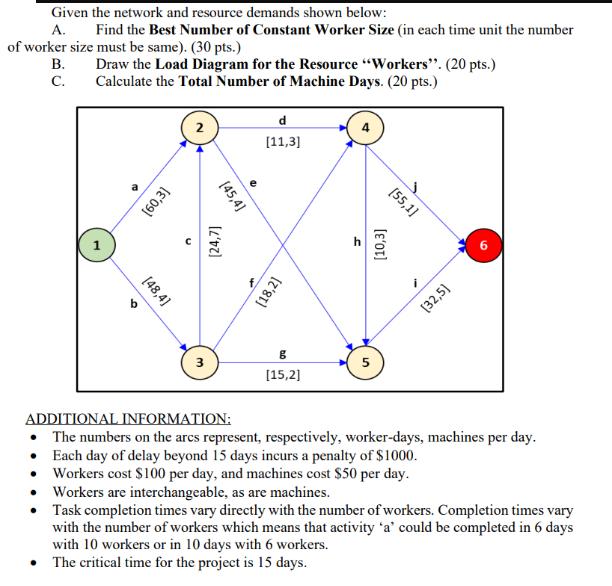
Given the network and resource demands shown below: A. Find the Best Number of Constant Worker Size (in each time unit the number of

Given the network and resource demands shown below: A. Find the Best Number of Constant Worker Size (in each time unit the number of worker size must be same). (30 pts.) Draw the Load Diagram for the Resource "Workers". (20 pts.) Calculate the Total Number of Machine Days. (20 pts.) B. C. L [48,4] [60,3] 2 3 [45,4] [24,7] d [11,3] (18,2] g [15,2] [55,1] J [10,3] 5 [32,5] ADDITIONAL INFORMATION: The numbers on the arcs represent, respectively, worker-days, machines per day. Each day of delay beyond 15 days incurs a penalty of $1000. Workers cost $100 per day, and machines cost $50 per day. Workers are interchangeable, as are machines. Task completion times vary directly with the number of workers. Completion times vary with the number of workers which means that activity 'a' could be completed in 6 days with 10 workers or in 10 days with 6 workers. The critical time for the project is 15 days.
Step by Step Solution
3.45 Rating (165 Votes )
There are 3 Steps involved in it
Step: 1
The best number of constant worker sizes in each time unit the number of worker sizes must be same T...
See step-by-step solutions with expert insights and AI powered tools for academic success
Step: 2

Step: 3

Ace Your Homework with AI
Get the answers you need in no time with our AI-driven, step-by-step assistance
Get Started


