

Question
Assume that you recently graduated with an MBA degree and have just landed a job as a financial planner with Henrys Investment Inc. Your first
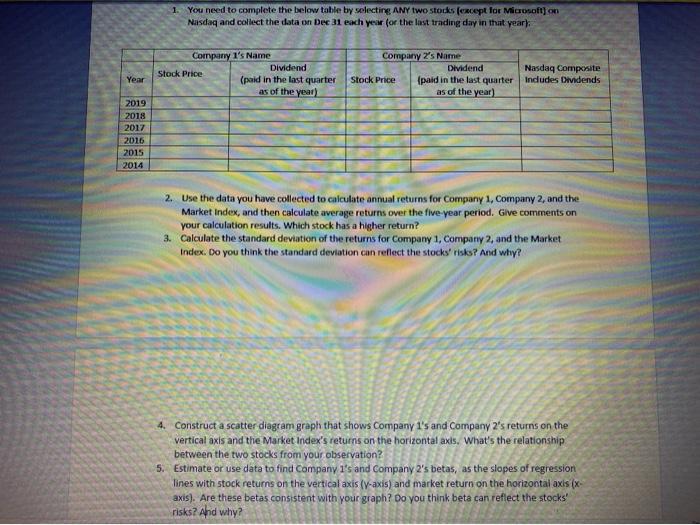
Assume that you recently graduated with an MBA degree and have just landed a job as a financial planner with Henrys Investment Inc. Your first assignment is to create a portfolio for a client by selecting two stocks on the market.
| Company 1s Name | Company 2s Name | Nasdaq Composite Includes Dividends | ||
Year | Stock Price
| Dividend (paid in the last quarter as of the year) | Stock Price | Dividend (paid in the last quarter as of the year) |
|
2019 |
|
|
|
|
|
2018 |
|
|
|
|
|
2017 |
|
|
|
|
|
2016 |
|
|
|
|
|
2015 |
|
|
|
|
|
2014 |
| ||||
Step by Step Solution
There are 3 Steps involved in it
Step: 1

Get Instant Access to Expert-Tailored Solutions
See step-by-step solutions with expert insights and AI powered tools for academic success
Step: 2

Step: 3
Ace Your Homework with AI
Get the answers you need in no time with our AI-driven, step-by-step assistance
Get Started
Emerging Markets And The Global Economy A Handbook
Authors: Mohammed El Hedi Arouri, Sabri Boubaker, Duc Khuong Nguyen
1st Edition
0124115497, 978-0124115491