Answered step by step
Verified Expert Solution
Question
1 Approved Answer
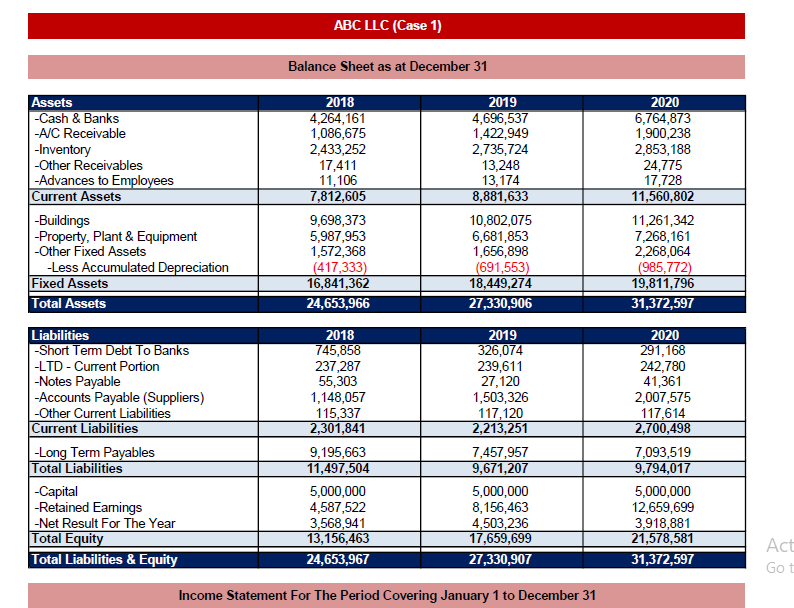
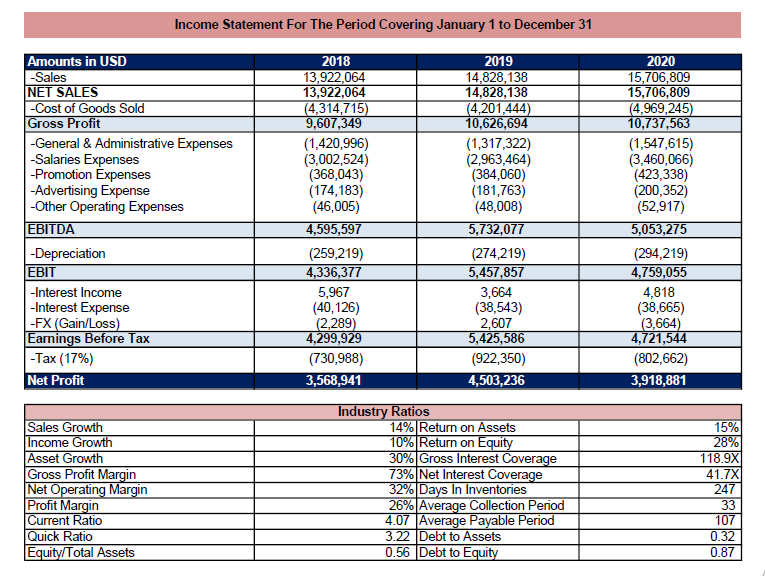
Assume the company will use a retention ratio of 40% in 2020 and the company has 10,000 shares outstanding : a. Calculate the DPS ratio;


Assume the company will use a retention ratio of 40% in 2020 and the company has 10,000 shares outstanding : a. Calculate the DPS ratio; b. Calculate the EPS ratio; c. In your opinion, what will be the impact on the balance sheet and the cash flows in 2020 and later on in 2021?
ABC LLC (Case 1) Balance Sheet as at December 31 Assets -Cash & Banks -A/C Receivable -Inventory -Other Receivables -Advances to Employees Current Assets - Buildings - Property, Plant & Equipment -Other Fixed Assets -Less Accumulated Depreciation Fixed Assets Total Assets 2018 4,264,161 1,086,675 2,433,252 17,411 11,106 7,812,605 9,698,373 5,987,953 1,572,368 (417,333) 16,841,362 24,653,966 2019 4,696,537 1,422,949 2,735,724 13,248 13,174 8,881,633 10,802,075 6,681,853 1,656,898 (691,553) 18,449,274 27,330,906 2020 6,764,873 1,900,238 2,853,188 24,775 17,728 11,560,802 11,261,342 7,268, 161 2,268,064 (985,772) 19,811,796 31,372,597 Liabilities Short Term Debt To Banks -LTD - Current Portion -Notes Payable -Accounts Payable (Suppliers) -Other Current Liabilities Current Liabilities -Long Term Payables Total Liabilities -Capital -Retained Earnings -Net Result For The Year Total Equity Total Liabilities & Equity 2018 745,858 237,287 55,303 1,148,057 115,337 2,301,841 9,195,663 11,497,504 5,000,000 4,587,522 3,568,941 13,156,463 24,653,967 2019 326,074 239,611 27,120 1,503,326 117,120 2,213,251 7,457,957 9,671,207 5,000,000 8, 156,463 4,503,236 17,659,699 27,330,907 2020 291,168 242,780 41,361 2,007,575 117,614 2,700,498 7,093,519 9,794,017 5,000,000 12,659,699 3,918,881 21,578,581 31,372,597 Act Go Income Statement For The Period Covering January 1 to December 31 Income Statement For The Period Covering January 1 to December 31 Amounts in USD -Sales NET SALES -Cost of Goods Sold Gross Profit -General & Administrative Expenses -Salaries Expenses -Promotion Expenses -Advertising Expense - Other Operating Expenses EBITDA -Depreciation EBIT -Interest Income -Interest Expense -FX (Gain/Loss) Earnings Before Tax -Tax (17%) Net Profit 2018 13,922,064 13,922,064 (4,314,715) 9,607,349 (1,420,996) (3,002,524) (368,043) (174,183) (46,005) 4,595,597 (259,219) 4,336,377 5,967 (40,126) (2,289) 4,299,929 (730,988) 3,568,941 2019 14,828,138 14,828,138 (4,201,444) 10,626,694 (1,317,322) (2,963,464) (384,060) (181,763) (48,008) 5,732,077 (274,219) 5,457,857 3,664 (38,543) 2,607 5,425,586 (922,350) 4,503,236 2020 15,706,809 15,706,809 (4,969,245) 10,737,563 (1,547,615) (3,460,066) (423,338) (200,352) (52,917) 5,053,275 (294,219) 4,759,055 4,818 (38,665) (3,664) 4,721,544 (802,662) 3,918,881 Sales Growth Income Growth Asset Growth Gross Profit Margin Net Operating Margin Profit Margin Current Ratio Quick Ratio Equity/Total Assets Industry Ratios 14% Return on Assets 10% Return on Equity 30% Gross Interest Coverage 73% Net Interest Coverage 32% Days In Inventories 26% Average Collection Period 4.07 Average Payable Period 3.22 Debt to Assets 0.56 Debt to Equity 15% 28% 118.9X 41.7% 247 33 107 0.32 0.87Step by Step Solution
There are 3 Steps involved in it
Step: 1

Get Instant Access to Expert-Tailored Solutions
See step-by-step solutions with expert insights and AI powered tools for academic success
Step: 2

Step: 3

Ace Your Homework with AI
Get the answers you need in no time with our AI-driven, step-by-step assistance
Get Started


