Assume the valuation date for hte subject company is 12/31/2019. Use the capitalization of benefits method to the income approach. Value the subject company using the single-period model and base this on dividends using the mid year convention. Compute the share price to the nearest whole penny.


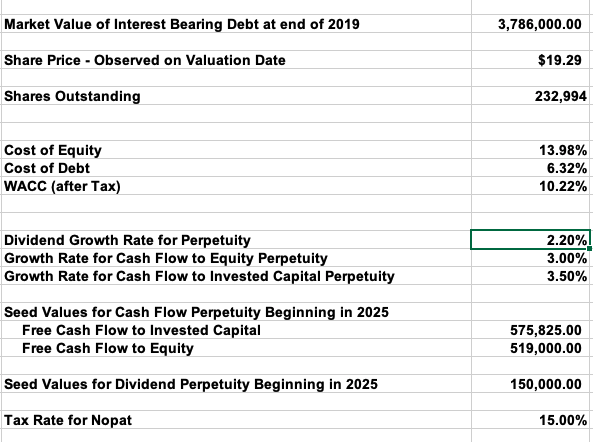
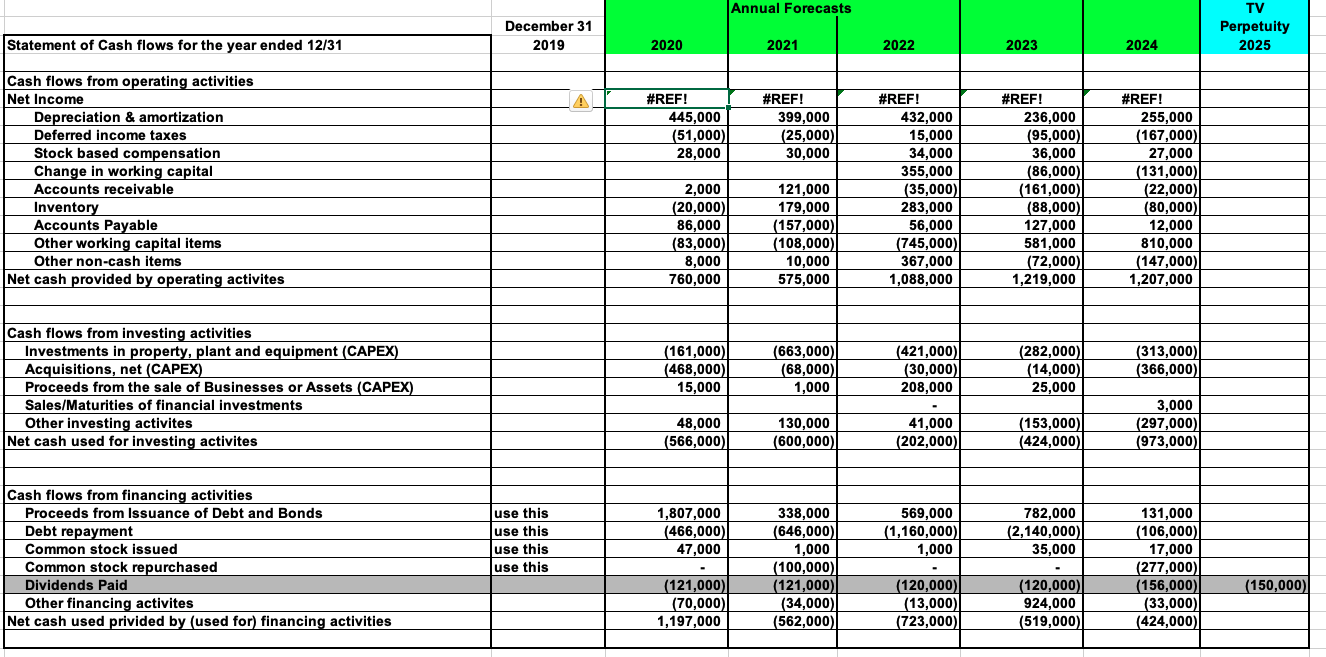
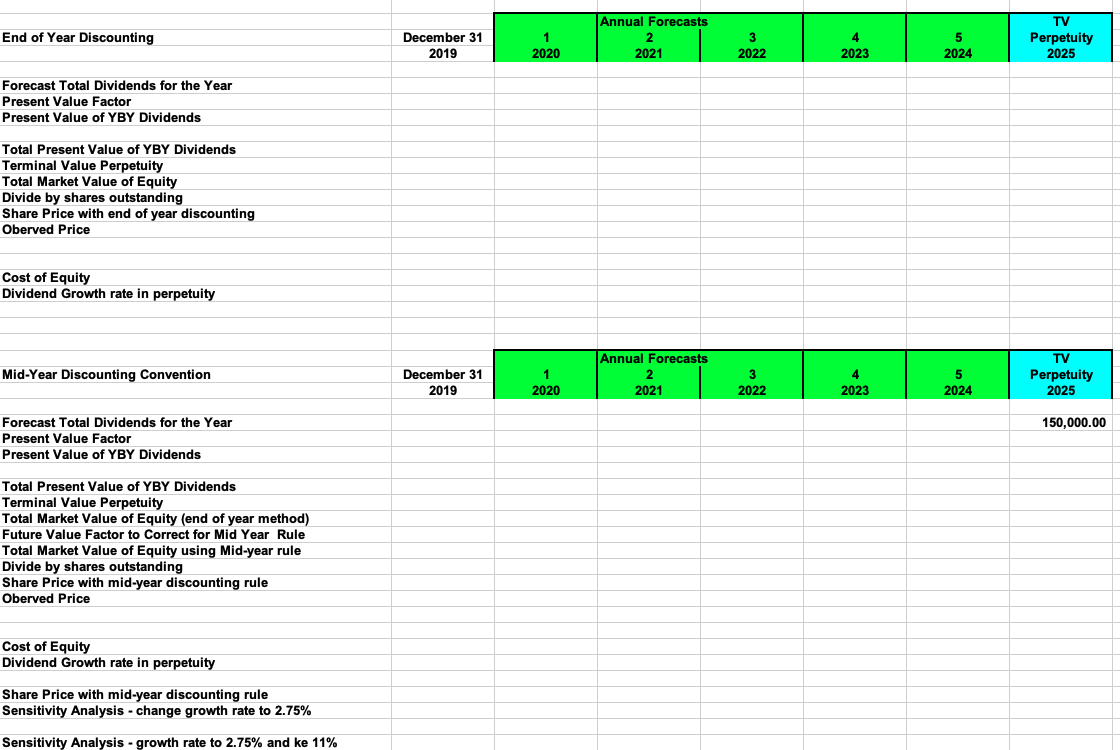
Market Value of Interest Bearing Debt at end of 2019 3,786,000.00 Share Price - Observed on Valuation Date $19.29 Shares Outstanding 232,994 Cost of Equity Cost of Debt WACC (after Tax) 13.98% 6.32% 10.22% Dividend Growth Rate for Perpetuity Growth Rate for Cash Flow to Equity Perpetuity Growth Rate for Cash Flow to Invested Capital Perpetuity 2.20% 3.00% 3.50% Seed Values for Cash Flow Perpetuity Beginning in 2025 Free Cash Flow to Invested Capital Free Cash Flow to Equity 575,825.00 519,000.00 Seed Values for Dividend Perpetuity Beginning in 2025 150,000.00 Tax Rate for Nopat 15.00% Annual Forecasts December 31 2019 TV Perpetuity 2025 Statement of Cash flows for the year ended 12/31 2020 2021 2022 2023 2024 #REF! 445,000 (51,000) 28,000 #REF! 399,000 (25,000) 30,000 Cash flows from operating activities Net Income Depreciation & amortization Deferred income taxes Stock based compensation Change in working capital Accounts receivable Inventory Accounts Payable Other working capital items Other non-cash items Net cash provided by operating activites 2,000 (20,000) 86,000 (83,000) 8,000 760,000 121,000 179,000 (157,000) (108,000) 10,000 575,000 #REF! 432,000 15,000 34,000 355,000 (35,000) 283,000 56,000 (745,000) 367,000 1,088,000 #REF! 236,000 (95,000) 36,000 (86,000) (161,000) (88,000) 127,000 581,000 (72,000) 1,219,000 #REF! 255,000 (167,000) 27,000 (131,000) (22,000) (80,000) 12,000 810,000 (147,000) 1,207,000 Cash flows from investing activities Investments in property, plant and equipment (CAPEX) Acquisitions, net (CAPEX) Proceeds from the sale of Businesses or Assets (CAPEX) Sales/Maturities of financial investments Other investing activites Net cash used for investing activites (161,000) (468,000) 15,000 (663,000) (68,000) 1,000 (421,000) (30,000) 208,000 (282,000) (14,000) 25,000 (313,000) (366,000) 48,000 (566,000) 130,000 (600,000) 41,000 (202,000) (153,000) (424,000) 3,000 (297,000) (973,000) use this use this use this use this 1,807,000 (466,000)| 47,000 569,000 (1,160,000) 1,000 Cash flows from financing activities Proceeds from Issuance of Debt and Bonds Debt repayment Common stock issued Common stock repurchased Dividends Paid Other financing activites Net cash used privided by (used for) financing activities 782,000 (2,140,000) 35,000 338,000 (646,000)| 1,000 (100,000) (121,000) (34,000) (562,000) 131,000 (106,000) 17,000 (277,000) (156,000) (33,000) (424,000) (150,000) (121,000) (70,000) 1,197,000 (120,000) (13,000) (723,000) (120,000) 924,000 (519,000) End of Year Discounting December 31 2019 1 2020 Annual Forecasts 2 2021 3 2022 4 2023 5 2024 TV Perpetuity 2025 Forecast Total Dividends for the Year Present Value Factor Present Value of YBY Dividends Total Present Value of YBY Dividends Terminal Value Perpetuity Total Market Value of Equity Divide by shares outstanding Share Price with end of year discounting Oberved Price Cost of Equity Dividend Growth rate in perpetuity Mid-Year Discounting Convention December 31 2019 1 2020 Annual Forecasts 2 2021 3 2022 4 2023 5 2024 TV Perpetuity 2025 150,000.00 Forecast Total Dividends for the Year Present Value Factor Present Value of YBY Dividends Total Present Value of YBY Dividends Terminal Value Perpetuity Total Market Value of Equity (end of year method) Future Value Factor to correct for Mid Year Rule Total Market Value of Equity using Mid-year rule Divide by shares outstanding Share Price with mid-year discounting rule Oberved Price Cost of Equity Dividend Growth rate in perpetuity Share Price with mid-year discounting rule Sensitivity Analysis - change growth rate to 2.75% Sensitivity Analysis - growth rate to 2.75% and ke 11% Market Value of Interest Bearing Debt at end of 2019 3,786,000.00 Share Price - Observed on Valuation Date $19.29 Shares Outstanding 232,994 Cost of Equity Cost of Debt WACC (after Tax) 13.98% 6.32% 10.22% Dividend Growth Rate for Perpetuity Growth Rate for Cash Flow to Equity Perpetuity Growth Rate for Cash Flow to Invested Capital Perpetuity 2.20% 3.00% 3.50% Seed Values for Cash Flow Perpetuity Beginning in 2025 Free Cash Flow to Invested Capital Free Cash Flow to Equity 575,825.00 519,000.00 Seed Values for Dividend Perpetuity Beginning in 2025 150,000.00 Tax Rate for Nopat 15.00% Annual Forecasts December 31 2019 TV Perpetuity 2025 Statement of Cash flows for the year ended 12/31 2020 2021 2022 2023 2024 #REF! 445,000 (51,000) 28,000 #REF! 399,000 (25,000) 30,000 Cash flows from operating activities Net Income Depreciation & amortization Deferred income taxes Stock based compensation Change in working capital Accounts receivable Inventory Accounts Payable Other working capital items Other non-cash items Net cash provided by operating activites 2,000 (20,000) 86,000 (83,000) 8,000 760,000 121,000 179,000 (157,000) (108,000) 10,000 575,000 #REF! 432,000 15,000 34,000 355,000 (35,000) 283,000 56,000 (745,000) 367,000 1,088,000 #REF! 236,000 (95,000) 36,000 (86,000) (161,000) (88,000) 127,000 581,000 (72,000) 1,219,000 #REF! 255,000 (167,000) 27,000 (131,000) (22,000) (80,000) 12,000 810,000 (147,000) 1,207,000 Cash flows from investing activities Investments in property, plant and equipment (CAPEX) Acquisitions, net (CAPEX) Proceeds from the sale of Businesses or Assets (CAPEX) Sales/Maturities of financial investments Other investing activites Net cash used for investing activites (161,000) (468,000) 15,000 (663,000) (68,000) 1,000 (421,000) (30,000) 208,000 (282,000) (14,000) 25,000 (313,000) (366,000) 48,000 (566,000) 130,000 (600,000) 41,000 (202,000) (153,000) (424,000) 3,000 (297,000) (973,000) use this use this use this use this 1,807,000 (466,000)| 47,000 569,000 (1,160,000) 1,000 Cash flows from financing activities Proceeds from Issuance of Debt and Bonds Debt repayment Common stock issued Common stock repurchased Dividends Paid Other financing activites Net cash used privided by (used for) financing activities 782,000 (2,140,000) 35,000 338,000 (646,000)| 1,000 (100,000) (121,000) (34,000) (562,000) 131,000 (106,000) 17,000 (277,000) (156,000) (33,000) (424,000) (150,000) (121,000) (70,000) 1,197,000 (120,000) (13,000) (723,000) (120,000) 924,000 (519,000) End of Year Discounting December 31 2019 1 2020 Annual Forecasts 2 2021 3 2022 4 2023 5 2024 TV Perpetuity 2025 Forecast Total Dividends for the Year Present Value Factor Present Value of YBY Dividends Total Present Value of YBY Dividends Terminal Value Perpetuity Total Market Value of Equity Divide by shares outstanding Share Price with end of year discounting Oberved Price Cost of Equity Dividend Growth rate in perpetuity Mid-Year Discounting Convention December 31 2019 1 2020 Annual Forecasts 2 2021 3 2022 4 2023 5 2024 TV Perpetuity 2025 150,000.00 Forecast Total Dividends for the Year Present Value Factor Present Value of YBY Dividends Total Present Value of YBY Dividends Terminal Value Perpetuity Total Market Value of Equity (end of year method) Future Value Factor to correct for Mid Year Rule Total Market Value of Equity using Mid-year rule Divide by shares outstanding Share Price with mid-year discounting rule Oberved Price Cost of Equity Dividend Growth rate in perpetuity Share Price with mid-year discounting rule Sensitivity Analysis - change growth rate to 2.75% Sensitivity Analysis - growth rate to 2.75% and ke 11%


