Question
Assume you are considering growing 3 crops, cotton, wheat, and soybeans. Yield data over a 5-year period is given in the Table below: Cotton

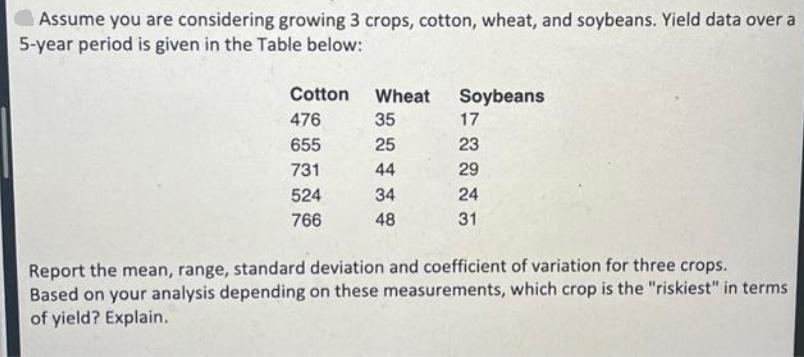
Assume you are considering growing 3 crops, cotton, wheat, and soybeans. Yield data over a 5-year period is given in the Table below: Cotton 476 655 731 524 766 Wheat 35 25 44 34 48 Soybeans 17 23 29 24 31 Report the mean, range, standard deviation and coefficient of variation for three crops. Based on your analysis depending on these measurements, which crop is the "riskiest" in terms of yield? Explain.
Step by Step Solution
There are 3 Steps involved in it
Step: 1
Lets calculate the mean range standard deviation and coefficient of variation for each of the three crops Cotton Wheat and Soybeans Cotton Yield Data ...
Get Instant Access to Expert-Tailored Solutions
See step-by-step solutions with expert insights and AI powered tools for academic success
Step: 2

Step: 3

Ace Your Homework with AI
Get the answers you need in no time with our AI-driven, step-by-step assistance
Get StartedRecommended Textbook for
Income Tax Fundamentals 2013
Authors: Gerald E. Whittenburg, Martha Altus Buller, Steven L Gill
31st Edition
1111972516, 978-1285586618, 1285586611, 978-1285613109, 978-1111972516
Students also viewed these Finance questions
Question
Answered: 1 week ago
Question
Answered: 1 week ago
Question
Answered: 1 week ago
Question
Answered: 1 week ago
Question
Answered: 1 week ago
Question
Answered: 1 week ago
Question
Answered: 1 week ago
Question
Answered: 1 week ago
Question
Answered: 1 week ago
Question
Answered: 1 week ago
Question
Answered: 1 week ago
Question
Answered: 1 week ago
Question
Answered: 1 week ago
Question
Answered: 1 week ago
Question
Answered: 1 week ago
Question
Answered: 1 week ago
Question
Answered: 1 week ago
Question
Answered: 1 week ago
Question
Answered: 1 week ago
Question
Answered: 1 week ago
Question
Answered: 1 week ago
Question
Answered: 1 week ago
Question
Answered: 1 week ago
View Answer in SolutionInn App


