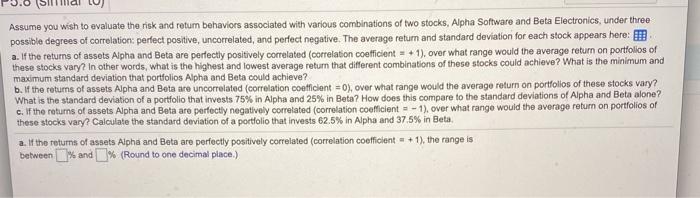
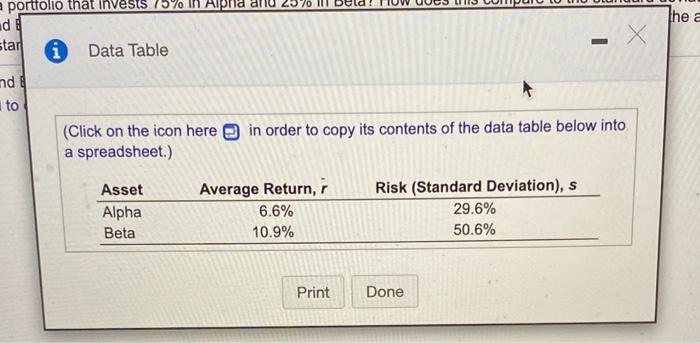
Assume you wish to evaluate the risk and retum behaviors associated with various combinations of two stocks, Alpha Software and Beta Electronics, under three possible degrees of correlation, perfect positive, uncorrelated, and perfect negative. The average return and standard deviation for each stock appears here: a. If the returns of assets Alpha and Beta are perfectly positively correlated (correlation coefficient - + 1). over what range would the average return on portfolios of these stocks vary? In other words, what is the highest and lowest average return that different combinations of these stocks could achieve? What is the minimum and maximum standard deviation that portfolios Alpha and Beta could achieve? b. If the retums of assets Alpha and Beta are uncorrelated (correlation coefficient = 0), over what range would the average return on portfolios of these stocks vary? What is the standard deviation of a portfolio that invests 75% in Alpha and 25% in Beta? How does this compare to the standard deviations of Alpha and Beta alone? c. If the returns of assets Alpha and Beta are perfectly negatively correlated (correlation coefficient = -1), over what range would the average return on portfolios of these stocks vary? Calculate the standard deviation of a portfolio that invests 62.5% in Alpha and 37.5% in Beta a. If the returns of assets Alpha and Beta are perfectly positively correlated (correlation coefficient + 1), the range is between % and % (Round to one decimal place.) the a a portfolio that invests 75% in Alpha d star Data Table X nd to in order to copy its contents of the data table below into (Click on the icon here a spreadsheet.) Asset Alpha Beta Average Return, 6.6% 10.9% Risk (Standard Deviation), s 29.6% 50.6% Print Done Assume you wish to evaluate the risk and retum behaviors associated with various combinations of two stocks, Alpha Software and Beta Electronics, under three possible degrees of correlation, perfect positive, uncorrelated, and perfect negative. The average return and standard deviation for each stock appears here: a. If the returns of assets Alpha and Beta are perfectly positively correlated (correlation coefficient - + 1). over what range would the average return on portfolios of these stocks vary? In other words, what is the highest and lowest average return that different combinations of these stocks could achieve? What is the minimum and maximum standard deviation that portfolios Alpha and Beta could achieve? b. If the retums of assets Alpha and Beta are uncorrelated (correlation coefficient = 0), over what range would the average return on portfolios of these stocks vary? What is the standard deviation of a portfolio that invests 75% in Alpha and 25% in Beta? How does this compare to the standard deviations of Alpha and Beta alone? c. If the returns of assets Alpha and Beta are perfectly negatively correlated (correlation coefficient = -1), over what range would the average return on portfolios of these stocks vary? Calculate the standard deviation of a portfolio that invests 62.5% in Alpha and 37.5% in Beta a. If the returns of assets Alpha and Beta are perfectly positively correlated (correlation coefficient + 1), the range is between % and % (Round to one decimal place.) the a a portfolio that invests 75% in Alpha d star Data Table X nd to in order to copy its contents of the data table below into (Click on the icon here a spreadsheet.) Asset Alpha Beta Average Return, 6.6% 10.9% Risk (Standard Deviation), s 29.6% 50.6% Print Done