- Assuming that IPO are $31 or $56, you would recommend it? Which one is more feasible? Take a position on which of the two business plans you would invest in as an investor, which financial instrument of the company you would want to invest in and what kind of a return you would expect on your money. You will need to make changes on the companys operations in order to increase growth rate to 50%, and in order to justify the $31 and $56 stock valuations.
- (theres no right or wrong asnwer, please just explain WHERE you would make changes and WHY)
- Please highlight where you would make changes
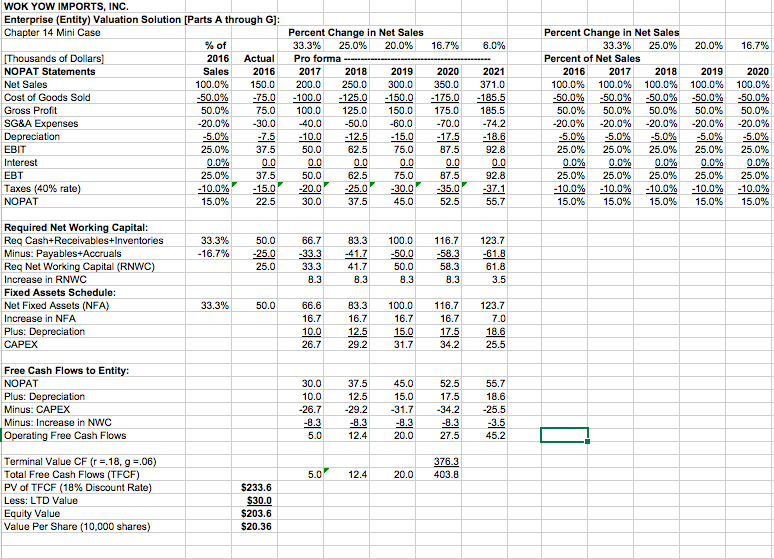
16.7% 6.0% 20.0% 16.7% WOK YOW IMPORTS, INC. Enterprise (Entity) Valuation Solution [Parts A through G]: Chapter 14 Mini Case % of Thousands of Dollars] 2016 Actual NOPAT Statements Sales 2016 Net Sales 100.0% 150.0 Cost of Goods Sold -50.0% -75.0 Gross Profit 50.0% 75.0 SG&A Expenses -20.0% -30.0 Depreciation -5.0% -7.5 EBIT 25.0% 37.5 Interest 0.0% 0.0 EBT 25.0% 37.5 Taxes (40% rate) -10.0% - 15.0 NOPAT 15.0% 22.5 Percent Change in Net Sales 33.3% 25.0% 20.0% Pro forma ----- 2017 2018 2019 200. 0 2 50.0 300.0 -100.0 125.0 -150.0 100.0 125.0 150.0 40.0 -50.0 -60.0 -10.0 -12.5 -15.0 50.0 62.5 75.0 0.0 50.0 625 75.0 20.0 25.0 30.0 30.0 37.5 45.0 2020 350.0 -175.0 175.0 -70.0 -17.5 37.5 0.0 87.5 35.0 52.5 525 2021 371.0 -185.5 185.5 -74.2 -18.6 92.8 0.0 92.8 -37.1 55.7 Percent Change in Net Sales 33.3% 25.0% Percent of Net Sales 2016 2017 2018 100.0% 100.0% 100.0% -50.0% -50.0% -50.0% 50.0% 50.0% 50.0% -20.0% -20.0% -20.0% -5.0% -5.0% -5,0% 25.0% 25.0% 25.0% 0.0% 0.0% 25.0% 25.0% 25.0% -10.0% -10.0% -10.0% 15.0% 15.0% 15.0% 2019 100.0% -50.0% 50.0% -20.0% -5.0% 25.0% 2020 100.0% -50.0% 50.0% -20.0% -5.0% 25.0% 0.0% 25.0% -10.0% 15.0% 0.0 0.0 25.0% -10.0% 15.0% 33.3% -16.7% 50.0 25.0 25.0 66.7 33.3 33.3 8.3 83.3 -41.7 41.7 9.3 100.0 -50.0 50.0 3.3 116.7 -58.3 58.3 3.3 123.7 -61.8 61.8 3.5 Required Net Working Capital: Reg Cash-Receivables+Inventories Minus: Payables Accruals Req Net Working Capital (RNWC) Increase in RNWC Fixed Assets Schedule: Net Fixed Assets (NFA) Increase in NFA Plus: Depreciation CAPEX 33.3% 50.0 66.6 16.7 10.0 26.7 83.3 16.7 12.5 29.2 100.0 16.7 15.0 31.7 116.7 16.7 17.5 34.2 123.7 7.0 18.6 25.5 Free Cash Flows to Entity: NOPAT Plus: Depreciation Minus: CAPEX Minus: Increase in NWC Operating Free Cash Flows 30.0 10.0 -26.7 -8.3 5.0 37.5 12.5 -29.2 45.0 15.0 -31.7 -8.3 20.0 52.5 17.5 -34.2 -8.3 27.5 55.7 18.6 25.5 -3.5 45.2 12.4 5.0 12.4 20.0 376.3 403.8 Terminal Value CF (r = 18, g =.06) Total Free Cash Flows (TFCF) PV of TFCF (18% Discount Rate) Less: LTD Value Equity Value Value Per Share (10,000 shares) $233.6 $30.0 $203.6 $20.36 16.7% 6.0% 20.0% 16.7% WOK YOW IMPORTS, INC. Enterprise (Entity) Valuation Solution [Parts A through G]: Chapter 14 Mini Case % of Thousands of Dollars] 2016 Actual NOPAT Statements Sales 2016 Net Sales 100.0% 150.0 Cost of Goods Sold -50.0% -75.0 Gross Profit 50.0% 75.0 SG&A Expenses -20.0% -30.0 Depreciation -5.0% -7.5 EBIT 25.0% 37.5 Interest 0.0% 0.0 EBT 25.0% 37.5 Taxes (40% rate) -10.0% - 15.0 NOPAT 15.0% 22.5 Percent Change in Net Sales 33.3% 25.0% 20.0% Pro forma ----- 2017 2018 2019 200. 0 2 50.0 300.0 -100.0 125.0 -150.0 100.0 125.0 150.0 40.0 -50.0 -60.0 -10.0 -12.5 -15.0 50.0 62.5 75.0 0.0 50.0 625 75.0 20.0 25.0 30.0 30.0 37.5 45.0 2020 350.0 -175.0 175.0 -70.0 -17.5 37.5 0.0 87.5 35.0 52.5 525 2021 371.0 -185.5 185.5 -74.2 -18.6 92.8 0.0 92.8 -37.1 55.7 Percent Change in Net Sales 33.3% 25.0% Percent of Net Sales 2016 2017 2018 100.0% 100.0% 100.0% -50.0% -50.0% -50.0% 50.0% 50.0% 50.0% -20.0% -20.0% -20.0% -5.0% -5.0% -5,0% 25.0% 25.0% 25.0% 0.0% 0.0% 25.0% 25.0% 25.0% -10.0% -10.0% -10.0% 15.0% 15.0% 15.0% 2019 100.0% -50.0% 50.0% -20.0% -5.0% 25.0% 2020 100.0% -50.0% 50.0% -20.0% -5.0% 25.0% 0.0% 25.0% -10.0% 15.0% 0.0 0.0 25.0% -10.0% 15.0% 33.3% -16.7% 50.0 25.0 25.0 66.7 33.3 33.3 8.3 83.3 -41.7 41.7 9.3 100.0 -50.0 50.0 3.3 116.7 -58.3 58.3 3.3 123.7 -61.8 61.8 3.5 Required Net Working Capital: Reg Cash-Receivables+Inventories Minus: Payables Accruals Req Net Working Capital (RNWC) Increase in RNWC Fixed Assets Schedule: Net Fixed Assets (NFA) Increase in NFA Plus: Depreciation CAPEX 33.3% 50.0 66.6 16.7 10.0 26.7 83.3 16.7 12.5 29.2 100.0 16.7 15.0 31.7 116.7 16.7 17.5 34.2 123.7 7.0 18.6 25.5 Free Cash Flows to Entity: NOPAT Plus: Depreciation Minus: CAPEX Minus: Increase in NWC Operating Free Cash Flows 30.0 10.0 -26.7 -8.3 5.0 37.5 12.5 -29.2 45.0 15.0 -31.7 -8.3 20.0 52.5 17.5 -34.2 -8.3 27.5 55.7 18.6 25.5 -3.5 45.2 12.4 5.0 12.4 20.0 376.3 403.8 Terminal Value CF (r = 18, g =.06) Total Free Cash Flows (TFCF) PV of TFCF (18% Discount Rate) Less: LTD Value Equity Value Value Per Share (10,000 shares) $233.6 $30.0 $203.6 $20.36