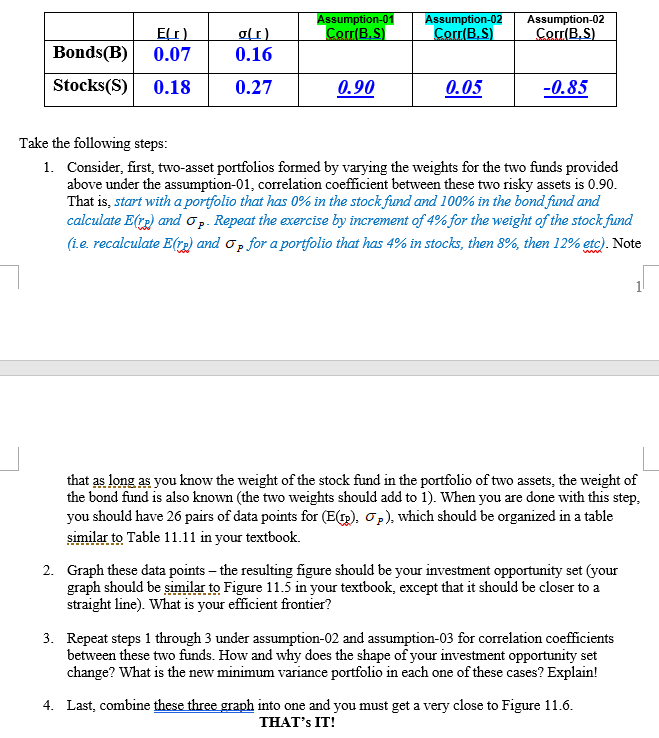
Assumption-02 CorrBS) Assumption-01 Assumption-02 Corr B.S) c) 0.07 (D 0.16 CorrBS) Bonds(B) Stocks(S) 0.18 0.27 0.90 0.05 -0.85 Take the following steps Consider, first, two-asset portfolios formed by varying the weights for the two funds provided above under the assumption-01, correlation coefficient between these two risky assets is 0.90 That is, start witha portfolio that has 0% in the stock fuund and 100% in the bond fund and calculate E(T) and op. Repeat the exercise by increment of 4% for the weight of the stock fund (ie. recalculate Ere) and o for a portfolio that has 4% in stocks, then 8%, then 12% etc). Note 1. that as long as you know the weight of the stock fund in the portfolio of two assets, the weight of the bond fund is also known (the two weights should add to 1). When you are done with this step you should have 26 pairs of data points for (E(), op), which should be organized in a table similar to Table 11.11 in your textbook 2 Graph these data points - the resulting figure should be your investment opportunity set (your graph should be imilar to Figure 11.5 in your textbook, except that it should be closer to a straight line). What is your efficient frontier? 2. Repeat steps 1 through 3 under assumption-02 and assumption-03 for correlation coefficients between these two funds. How and why does the shape of your investment opportunity change? What is the new minimum variance portfolio in each one of these cases? Explain! 3. set Last, combine these three graph into one and you must get a very close to Figure 11.6 4. THAT's IT! Assumption-02 CorrBS) Assumption-01 Assumption-02 Corr B.S) c) 0.07 (D 0.16 CorrBS) Bonds(B) Stocks(S) 0.18 0.27 0.90 0.05 -0.85 Take the following steps Consider, first, two-asset portfolios formed by varying the weights for the two funds provided above under the assumption-01, correlation coefficient between these two risky assets is 0.90 That is, start witha portfolio that has 0% in the stock fuund and 100% in the bond fund and calculate E(T) and op. Repeat the exercise by increment of 4% for the weight of the stock fund (ie. recalculate Ere) and o for a portfolio that has 4% in stocks, then 8%, then 12% etc). Note 1. that as long as you know the weight of the stock fund in the portfolio of two assets, the weight of the bond fund is also known (the two weights should add to 1). When you are done with this step you should have 26 pairs of data points for (E(), op), which should be organized in a table similar to Table 11.11 in your textbook 2 Graph these data points - the resulting figure should be your investment opportunity set (your graph should be imilar to Figure 11.5 in your textbook, except that it should be closer to a straight line). What is your efficient frontier? 2. Repeat steps 1 through 3 under assumption-02 and assumption-03 for correlation coefficients between these two funds. How and why does the shape of your investment opportunity change? What is the new minimum variance portfolio in each one of these cases? Explain! 3. set Last, combine these three graph into one and you must get a very close to Figure 11.6 4. THAT's IT


