Answered step by step
Verified Expert Solution
Question
1 Approved Answer
At the end of each line, provide a detailed one-sentence summary that indicates key insights about the performance for each line by answering this question:
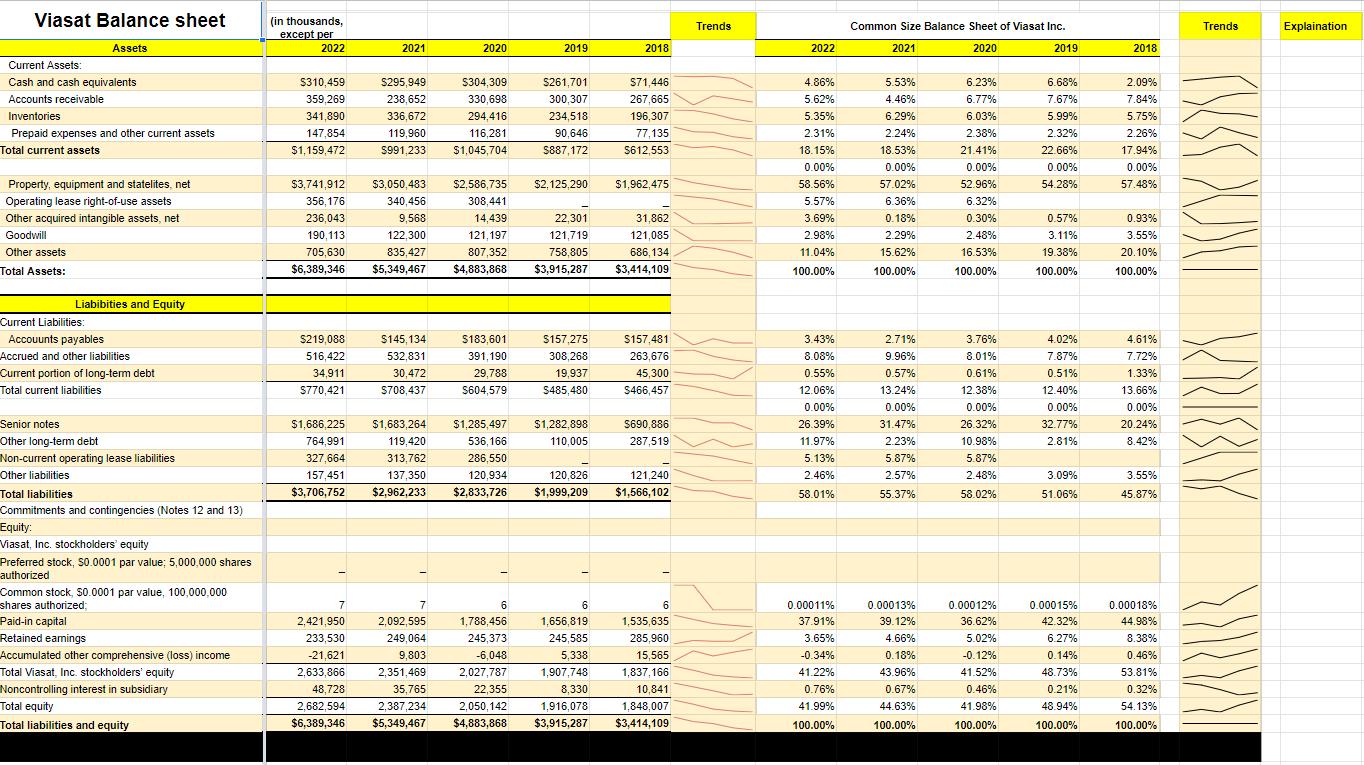
At the end of each line, provide a detailed one-sentence summary that indicates key insights about the performance for each line by answering this question: according to the annual report's management discussion and your analysis, what drove the changes on that line and is the change positive or negative and why.

Viasat Balance sheet Current Assets: Assets Cash and cash equivalents (in thousands, except per Trends Common Size Balance Sheet of Viasat Inc. Trends Explaination 2022 2021 2020 2019 2018 2022 2021 2020 2019 2018 $310,459 $295,949 $304,309 $261,701 $71,446 4.86% 5.53% 6.23% 6.68% 2.09% Accounts receivable 359,269 238,652 330,698 300,307 267,665 5.62% 4.46% 6.77% 7.67% 7.84% Inventories 341,890 336,672 294,416 234,518 196,307 5.35% 6.29% 6.03% 5.99% 5.75% Prepaid expenses and other current assets 147,854 119,960 116,281 90,646 77,135 2.31% 2.24% 2.38% 2.32% 2.26% Total current assets $1,159,472 $991,233 $1,045,704 $887,172 $612,553 18.15% 18.53% 21.41% 22.66% 17.94% 0.00% 0.00% 0.00% 0.00% 0.00% Property, equipment and statelites, net $3,741,912 $3,050,483 $2,586,735 $2,125,290 $1,962,475 58.56% 57.02% 52.96% 54.28% 57.48% Operating lease right-of-use assets 356,176 Other acquired intangible assets, net Goodwill 236,043 190,113 340,456 9,568 122,300 Other assets 705,630 835,427 Total Assets: $6,389,346 $5,349,467 308,441 14,439 121,197 807,352 $4,883,868 5.57% 6.36% 6.32% 22,301 31,862 3.69% 0.18% 0.30% 0.57% 0.93% 121,719 121,085 2.98% 2.29% 2.48% 3.11% 3.55% 758,805 686,134 11.04% 15.62% 16.53% 19.38% 20.10% $3,915,287 $3,414,109 100.00% 100.00% 100.00% 100.00% 100.00% XRKY Liabibities and Equity Current Liabilities: Accouunts payables Accrued and other liabilities Current portion of long-term debt $219,088 516,422 34,911 Total current liabilities $770,421 $145,134 532,831 30,472 $708,437 $183,601 $157,275 $157,481 3.43% 2.71% 3.76% 4.02% 4.61% 391,190 29,788 $604,579 308,268 19,937 $485,480 263,676 8.08% 9.96% 8.01% 7.87% 7.72% 45,300 0.55% 0.57% 0.61% 0.51% 1.33% $466,457 12.06% 13.24% 12.38% 12.40% 13.66% 0.00% 0.00% 0.00% 0.00% 0.00% Senior notes Other long-term debt $1,686,225 $1,683,264 764,991 119,420 $1,285,497 536,166 $1,282,898 $690,886 26.39% 31.47% 26.32% 32.77% 20.24% 110,005 287,519 11.97% 2.23% 10.98% 2.81% 8.42% Non-current operating lease liabilities 327,664 313,762 286,550 5.13% 5.87% 5.87% Other liabilities Total liabilities 157,451 137,350 120,934 120,826 121,240 2.46% 2.57% 2.48% 3.09% 3.55% $3,706,752 $2,962,233 $2,833,726 $1,999,209 $1,566,102 58.01% 55.37% 58.02% 51.06% 45.87% Commitments and contingencies (Notes 12 and 13) Equity: Viasat, Inc. stockholders' equity Preferred stock, $0.0001 par value; 5,000,000 shares authorized Common stock, $0.0001 par value, 100,000,000 shares authorized; 7 7 6 6 6 0.00011% Paid-in capital 2,421,950 Retained earnings 233,530 Accumulated other comprehensive (loss) income -21,621 Total Viasat, Inc. stockholders' equity 2,633,866 Noncontrolling interest in subsidiary Total equity Total liabilities and equity 48,728 2,682,594 $6,389,346 2,092,595 249,064 9,803 2,351,469 35,765 2,387,234 $5,349,467 1,788,456 245,373 -6,048 2,027,787 22,355 2,050,142 $4,883,868 1,656,819 245,585 5,338 1,907,748 8,330 1,916,078 $3,915,287 1,535,635 285,960 37.91% 0.00013% 39.12% 0.00012% 36.62% 0.00015% 0.00018% 42.32% 44.98% 3.65% 4.66% 5.02% 6.27% 8.38% 15,565 -0.34% 0.18% -0.12% 0.14% 0.46% 1,837,166 41.22% 43.96% 41.52% 48.73% 53.81% 10,841 0.76% 0.67% 0.46% 0.21% 1,848,007 $3,414,109 41.99% 44.63% 100.00% 100.00% 41.98% 100.00% 48.94% 100.00% 0.32% 54.13% 100.00%
Step by Step Solution
★★★★★
3.41 Rating (148 Votes )
There are 3 Steps involved in it
Step: 1
Current Assets Cash and Cash Equivalents The consistent growth in cash and cash equivalents from 201...
Get Instant Access to Expert-Tailored Solutions
See step-by-step solutions with expert insights and AI powered tools for academic success
Step: 2

Step: 3

Ace Your Homework with AI
Get the answers you need in no time with our AI-driven, step-by-step assistance
Get Started


