Answered step by step
Verified Expert Solution
Question
1 Approved Answer
Attached documents will provide information to answer the question on Diagnostic analytics Based on the data you and your team have compiled, you begin to

Attached documents will provide information to answer the question on Diagnostic analytics
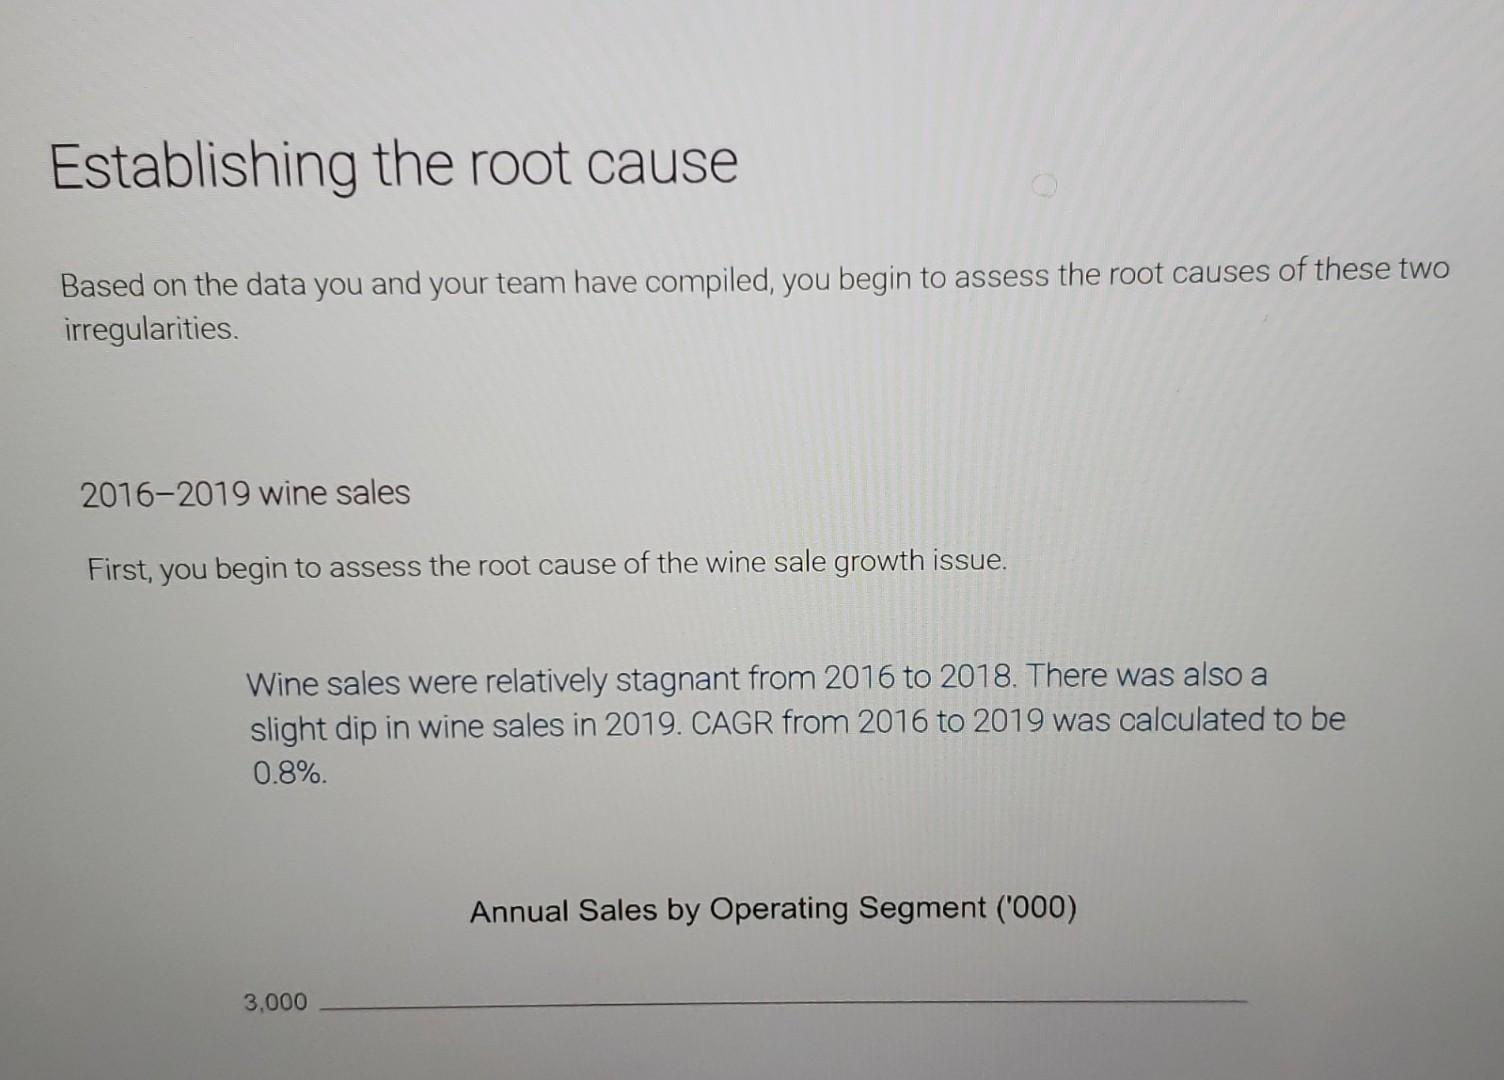
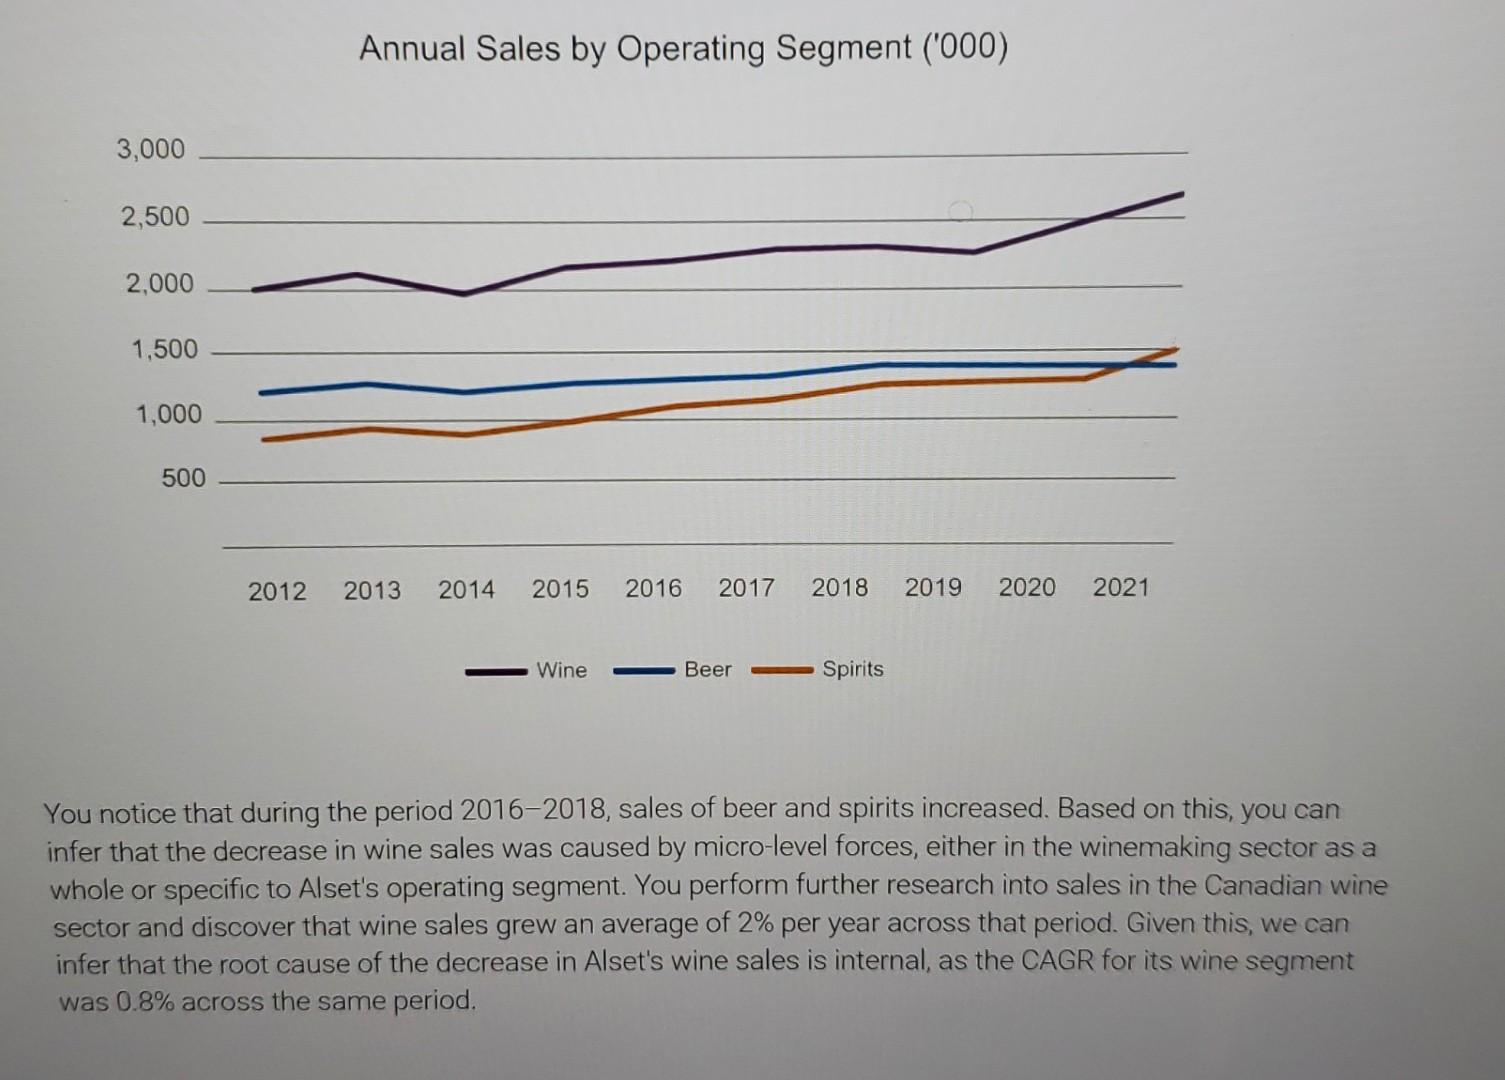
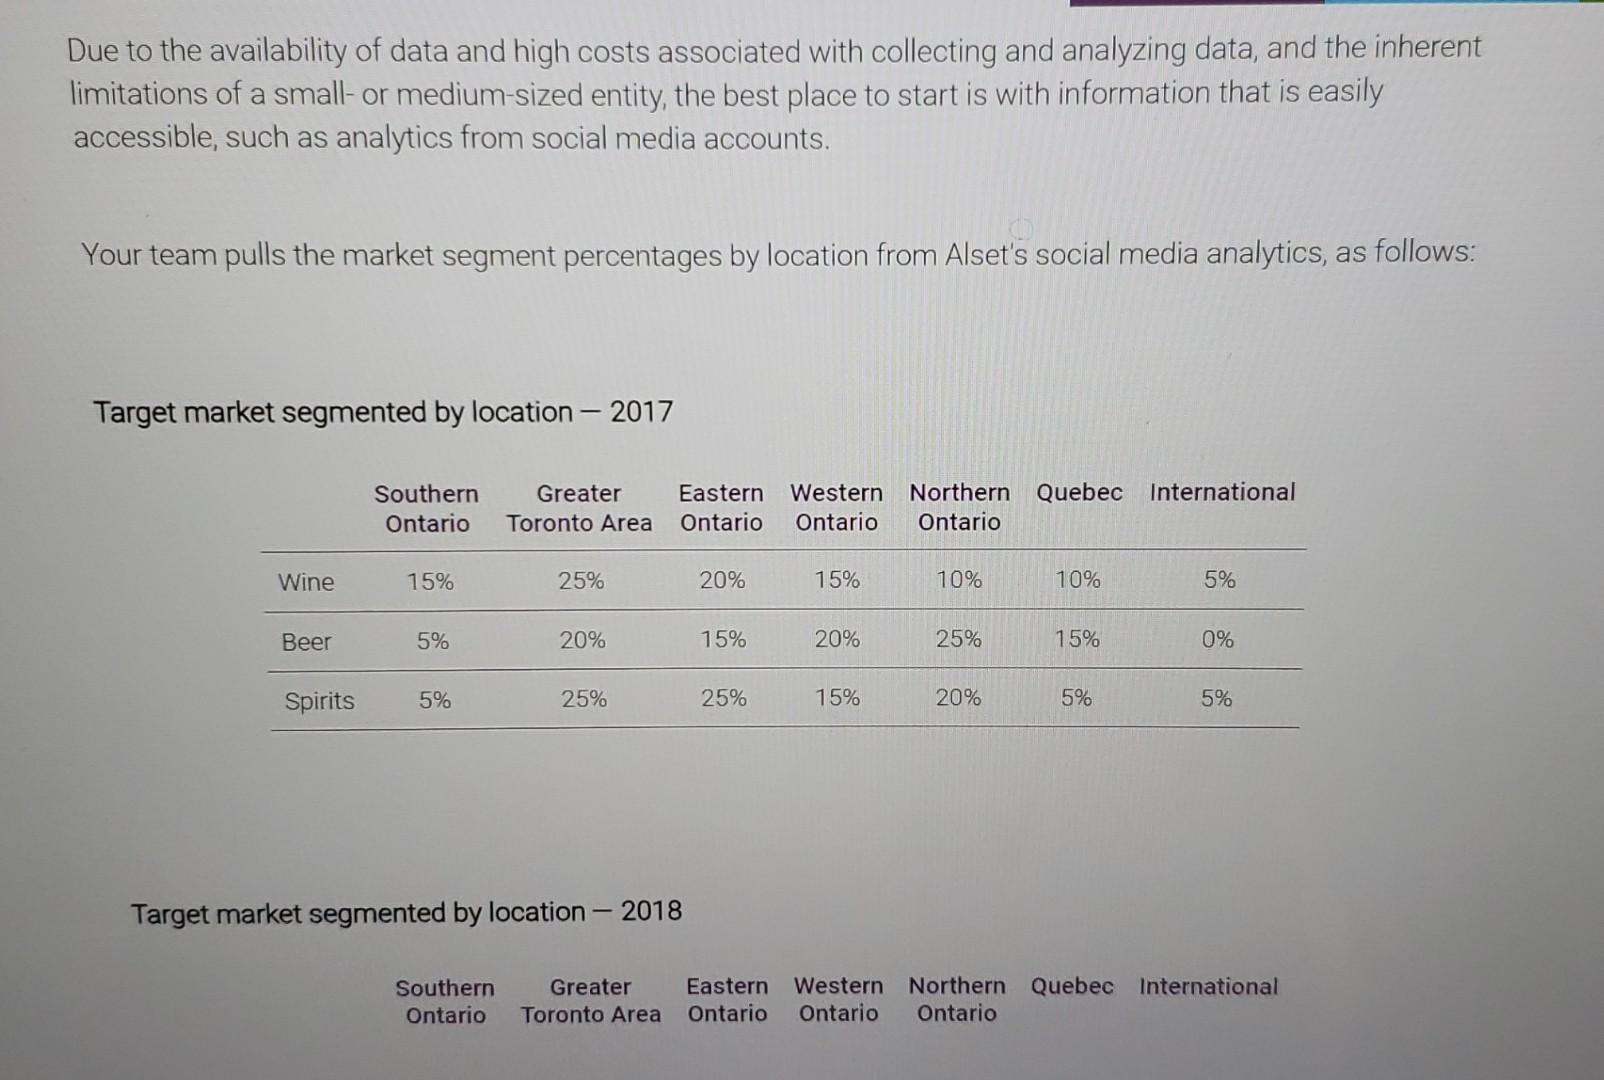
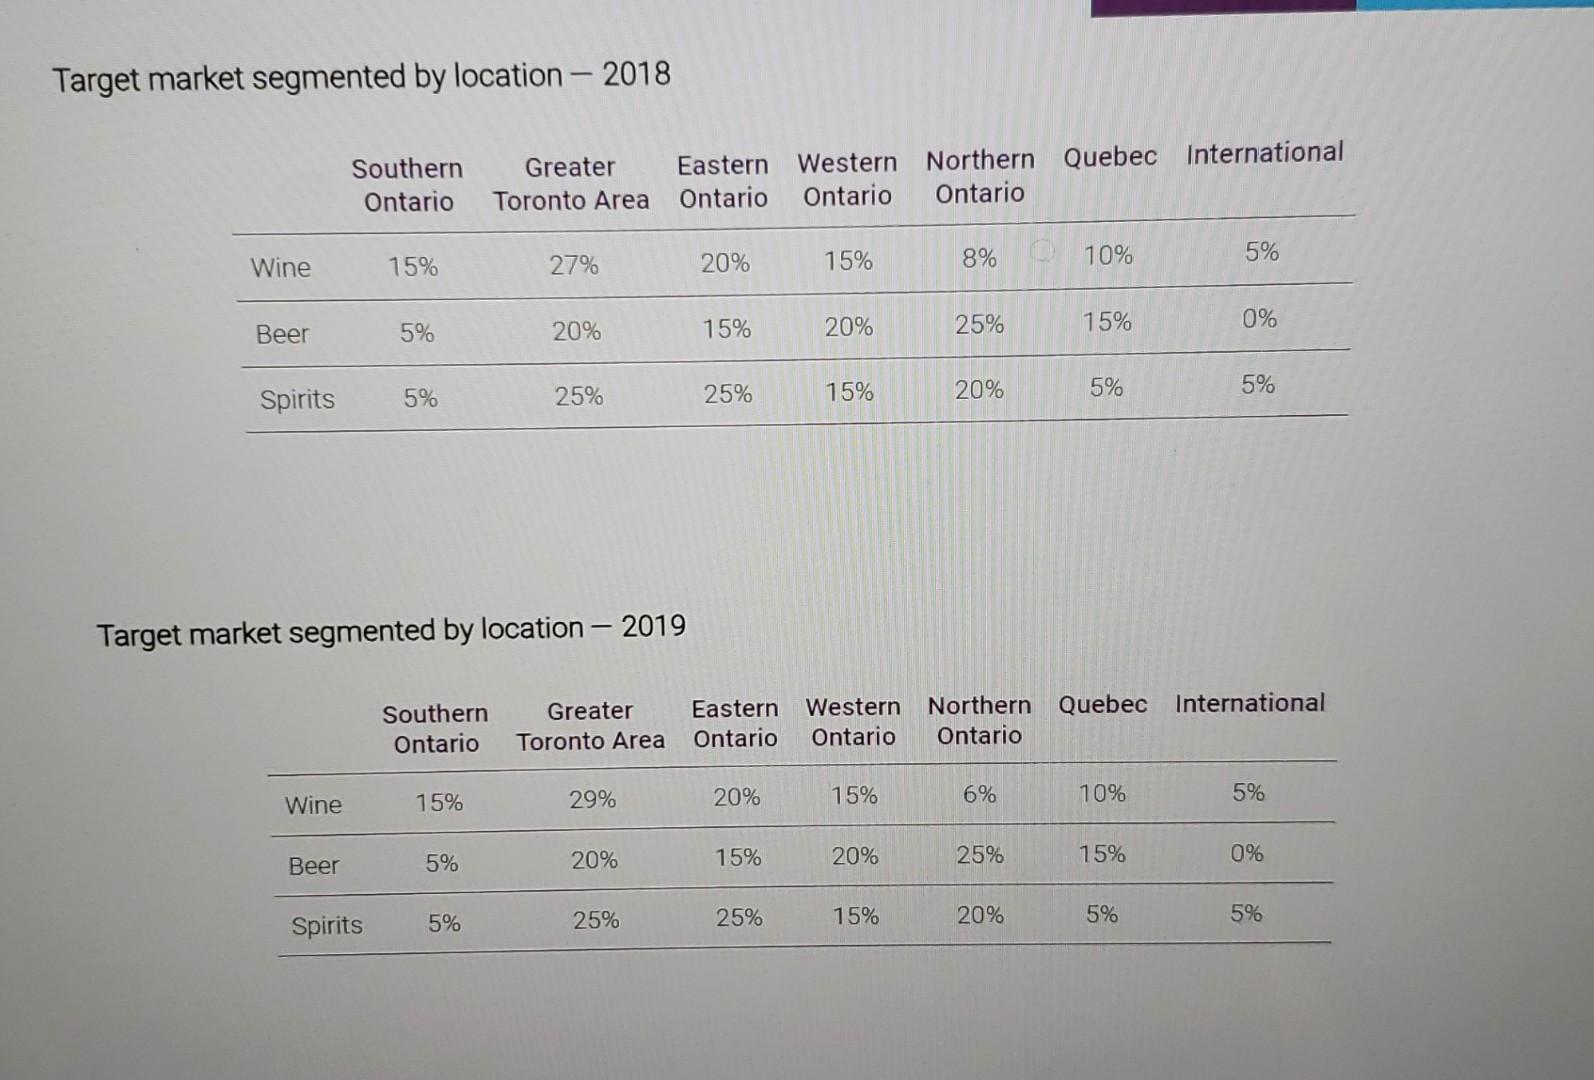
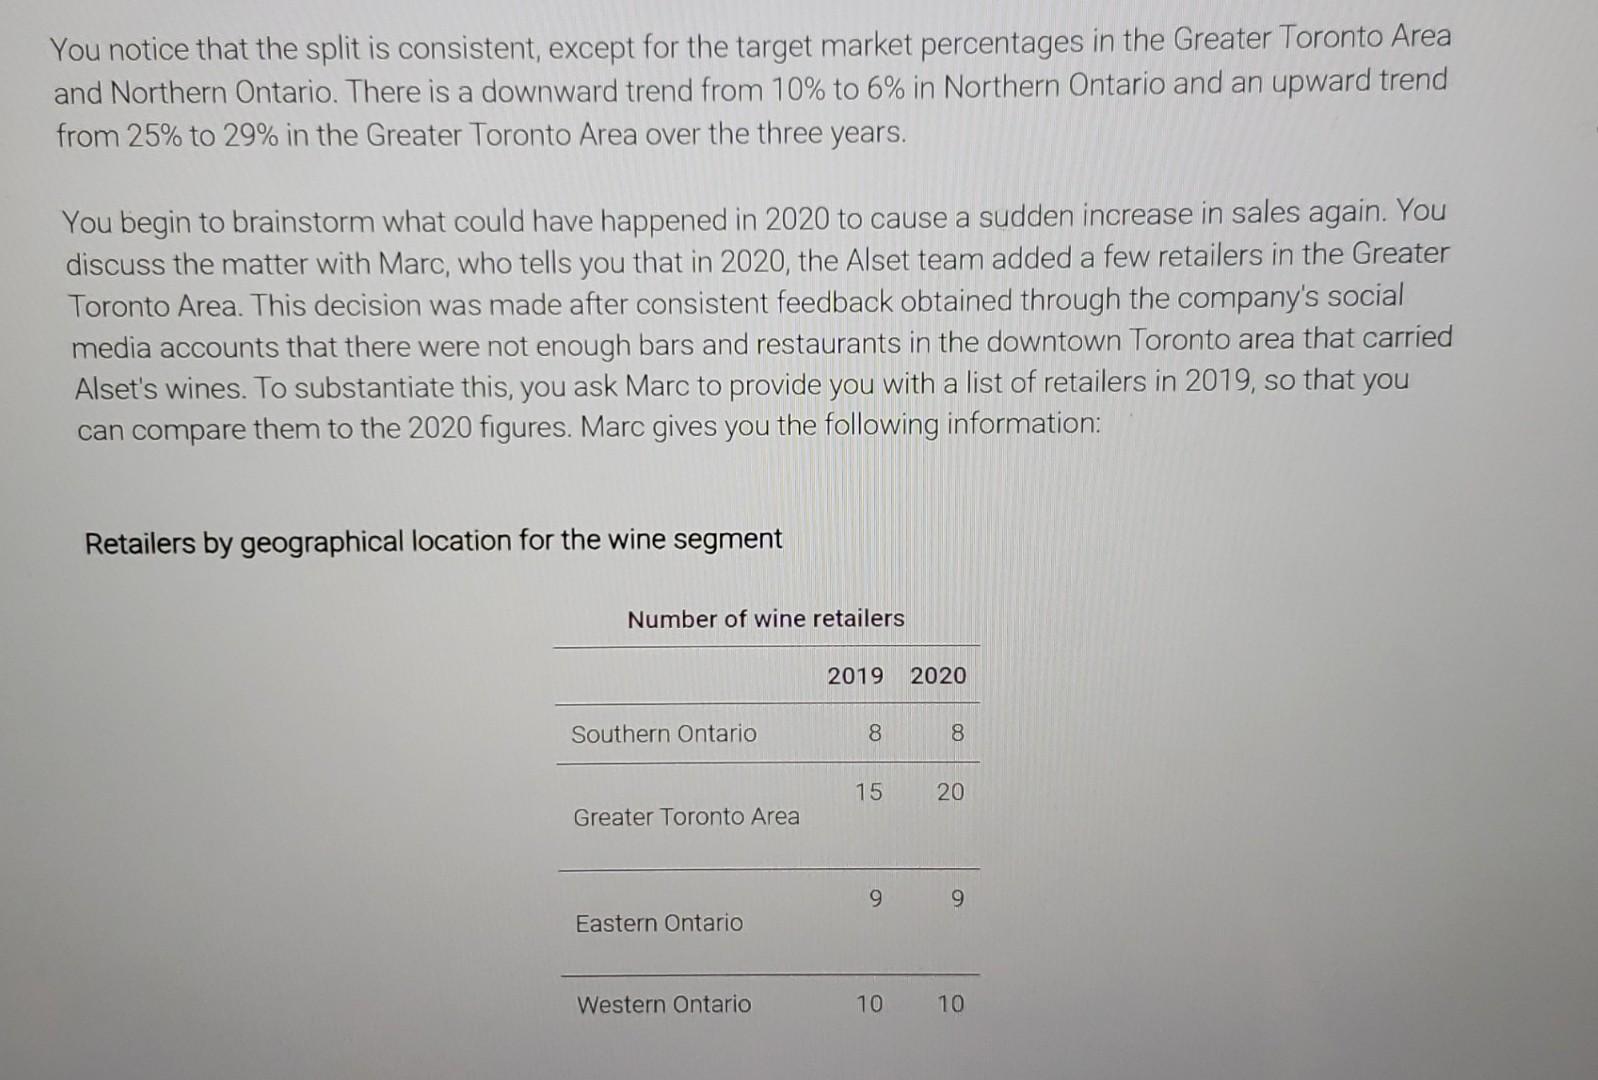
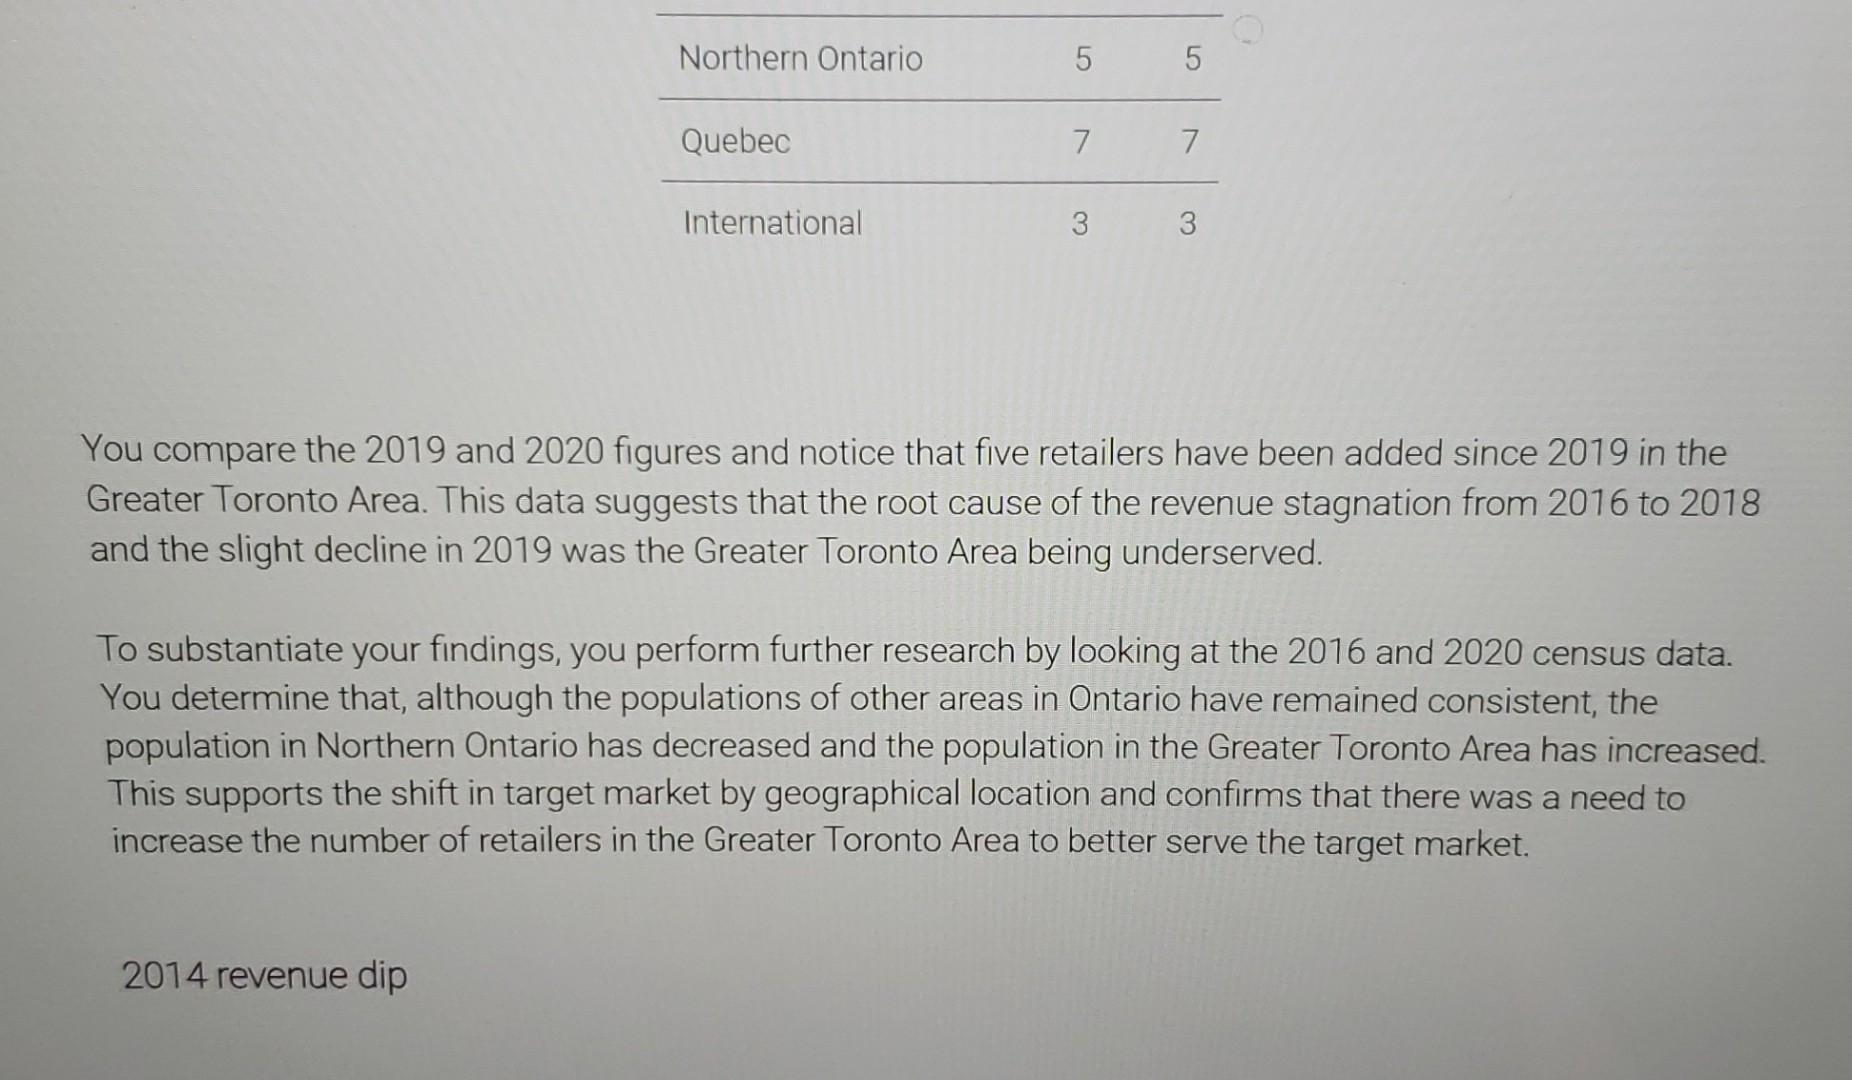
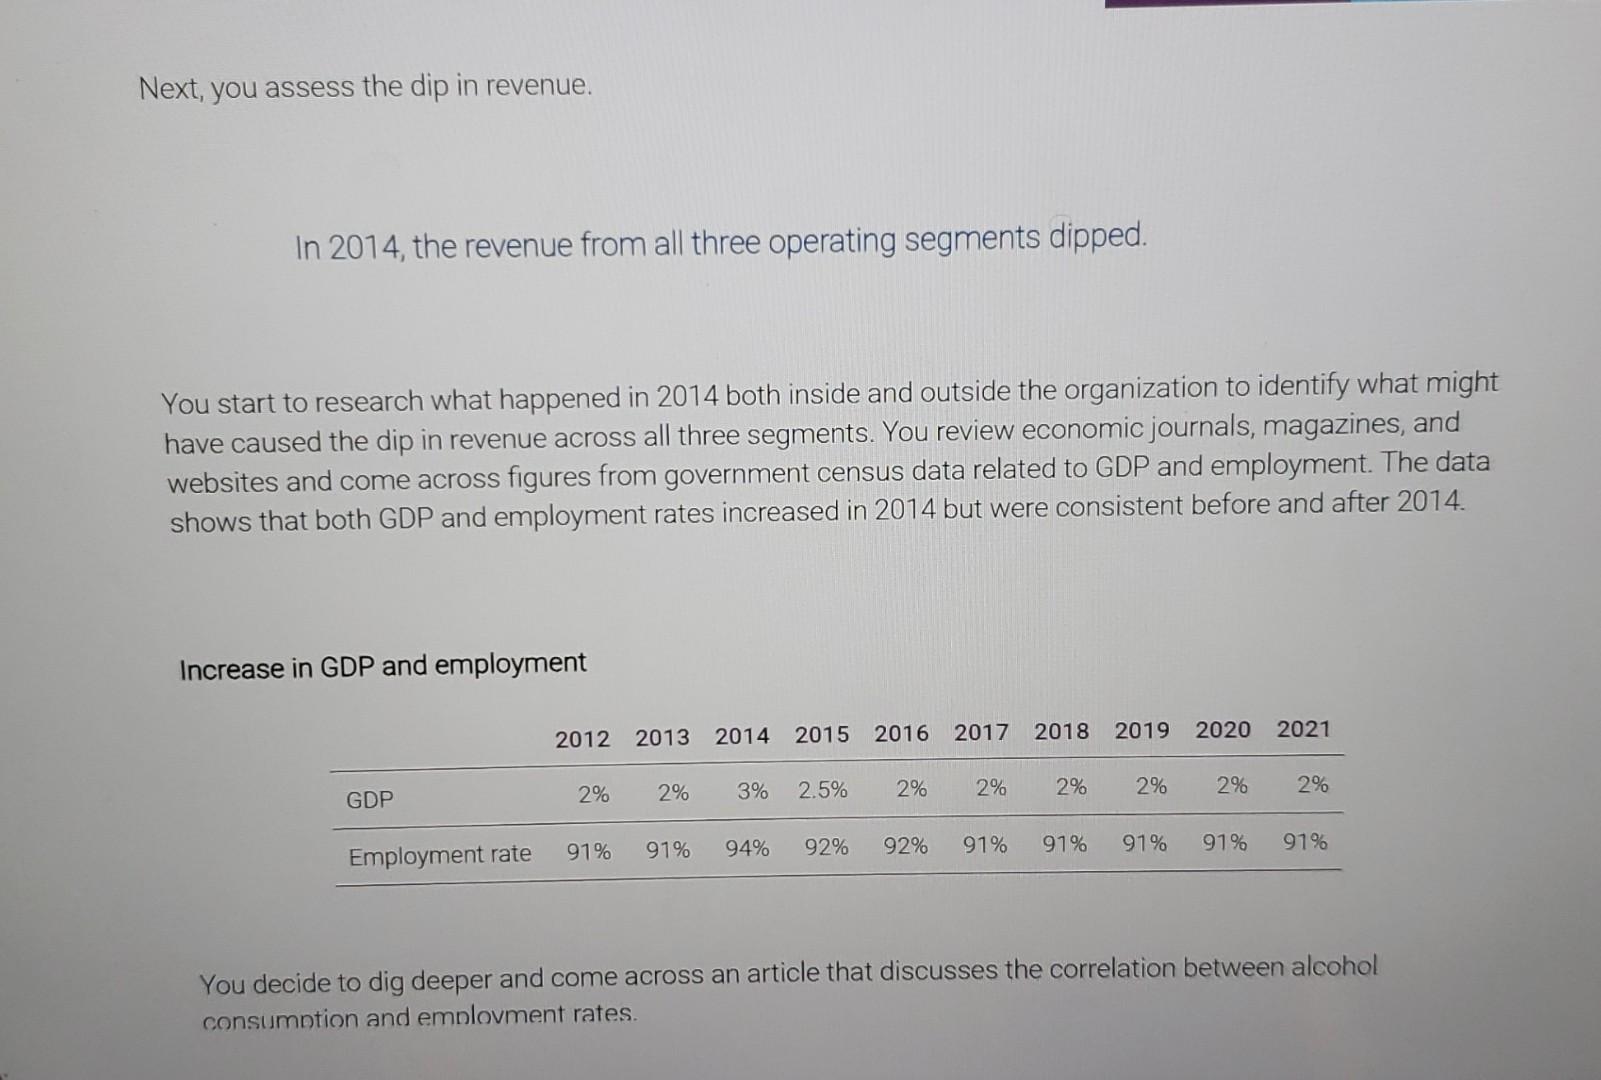
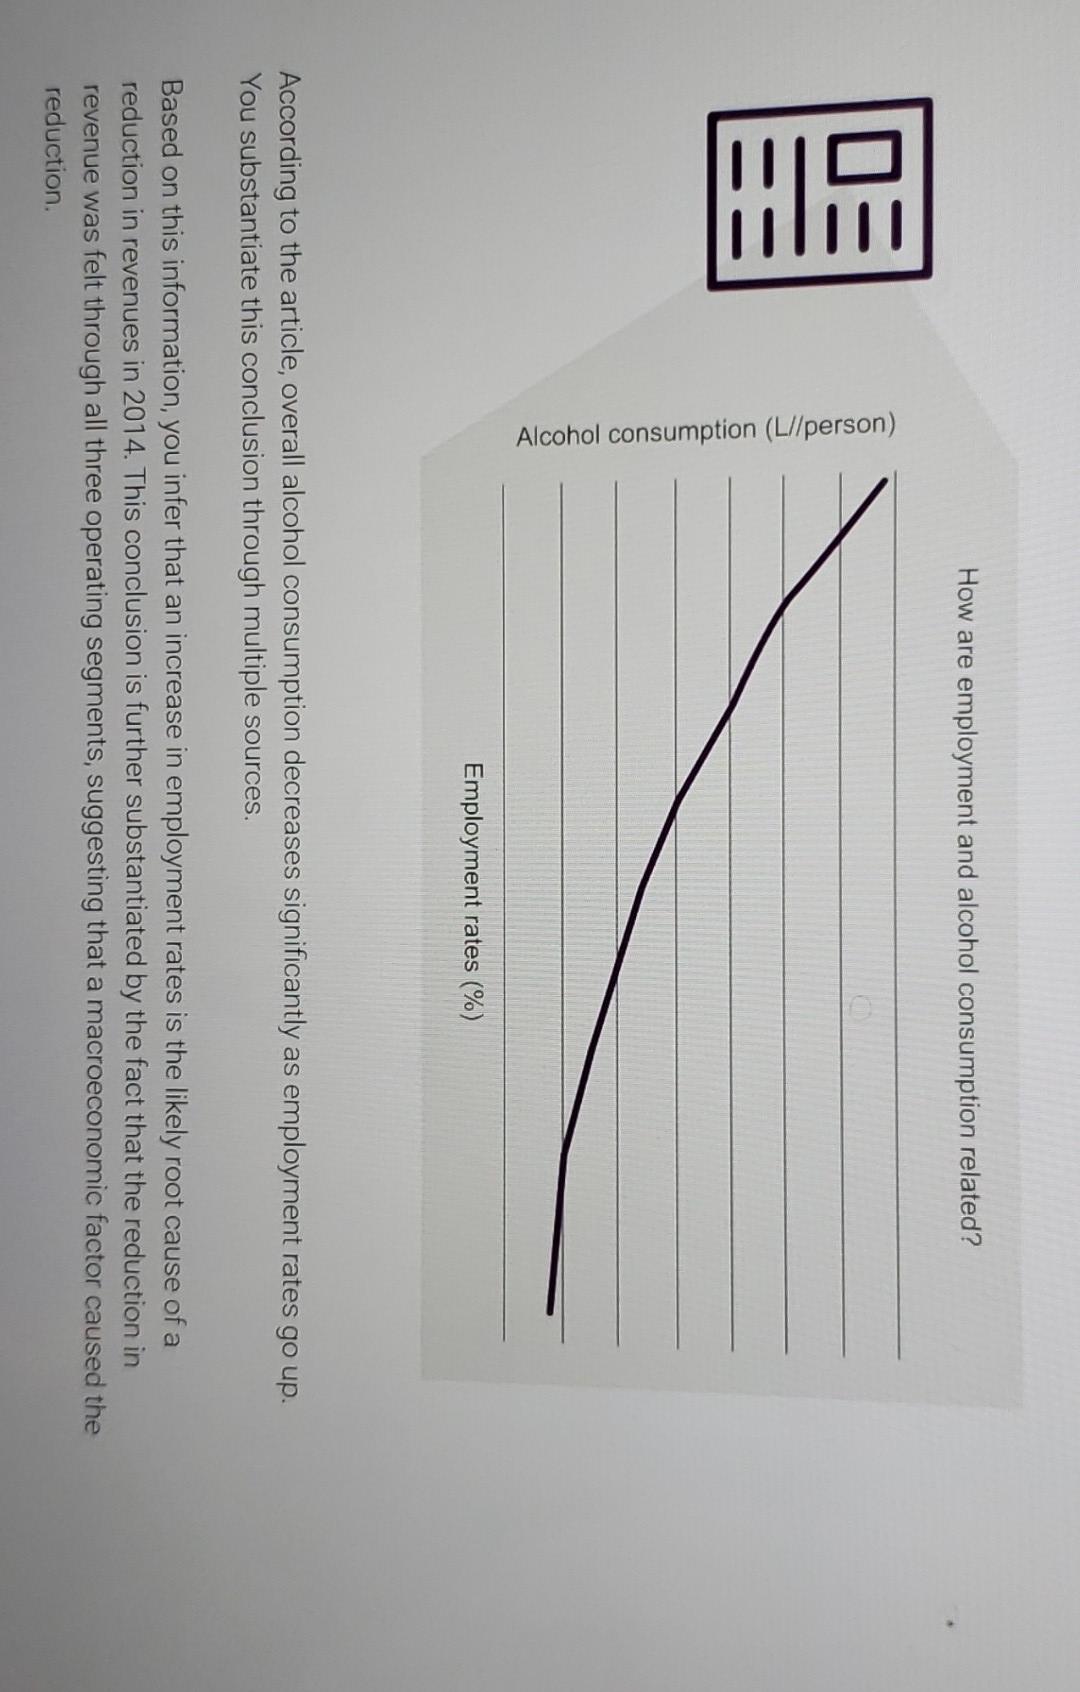
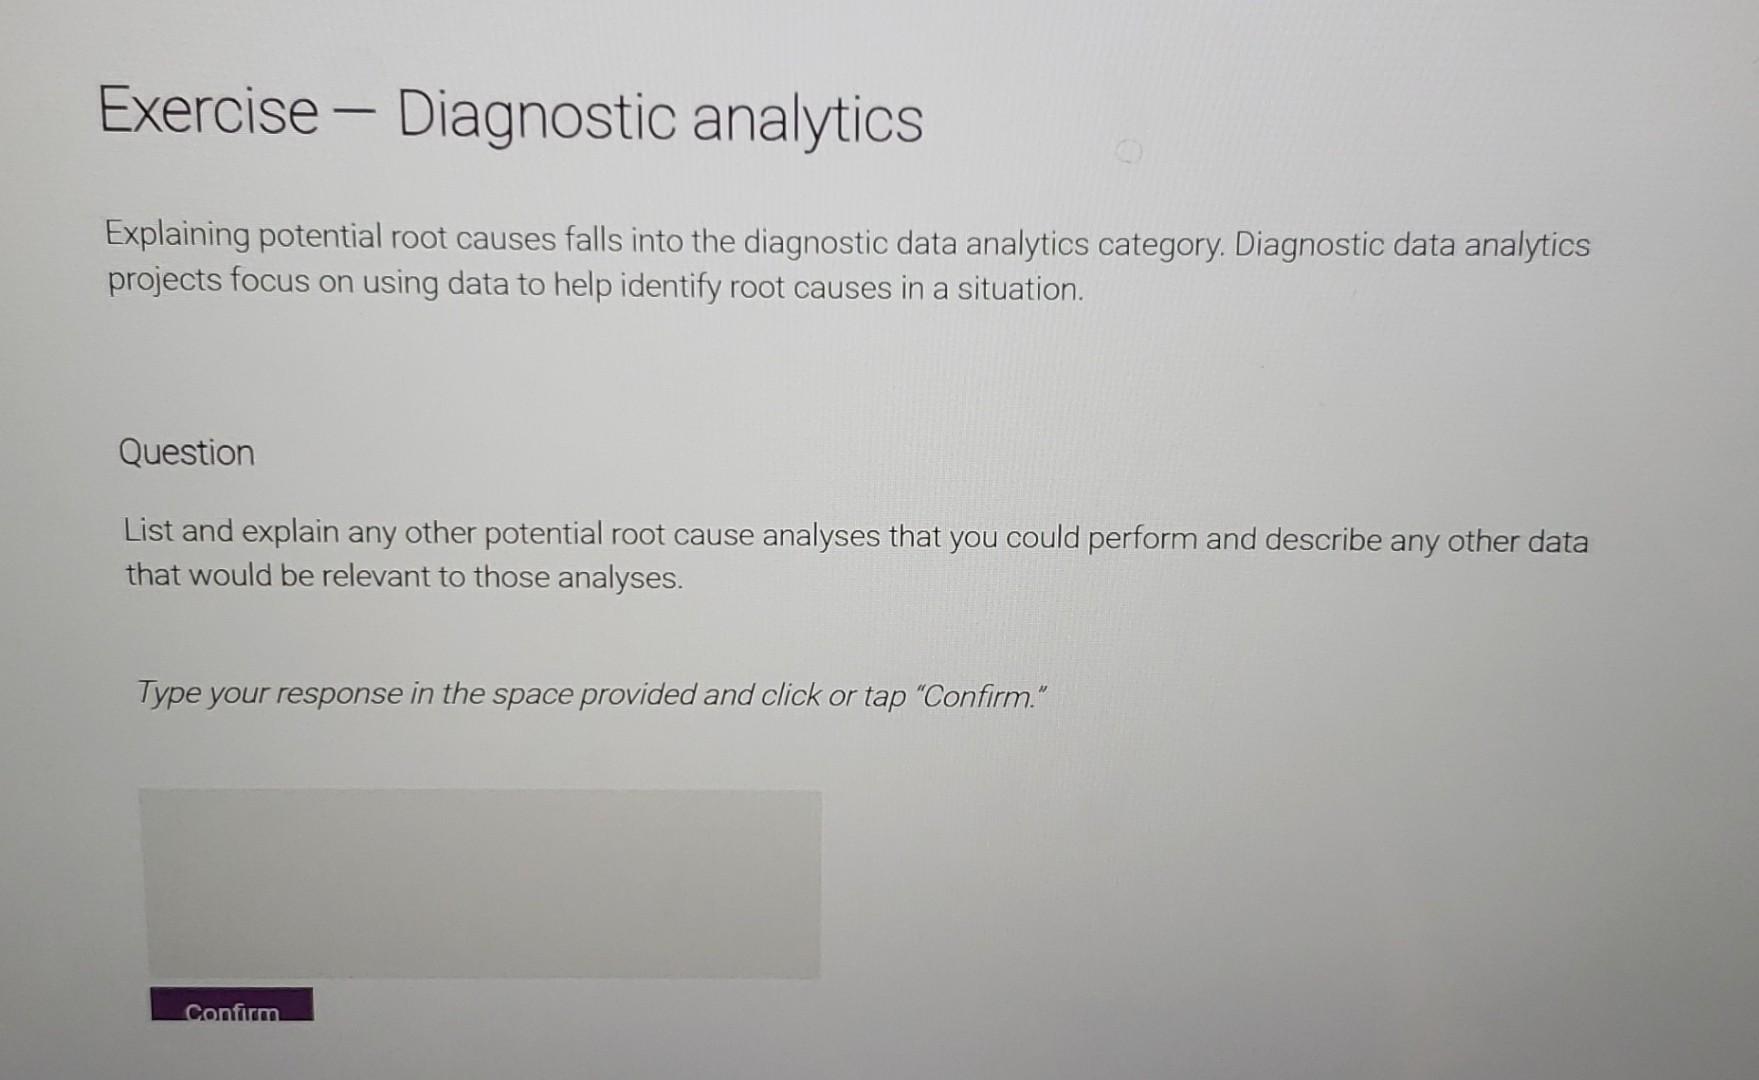
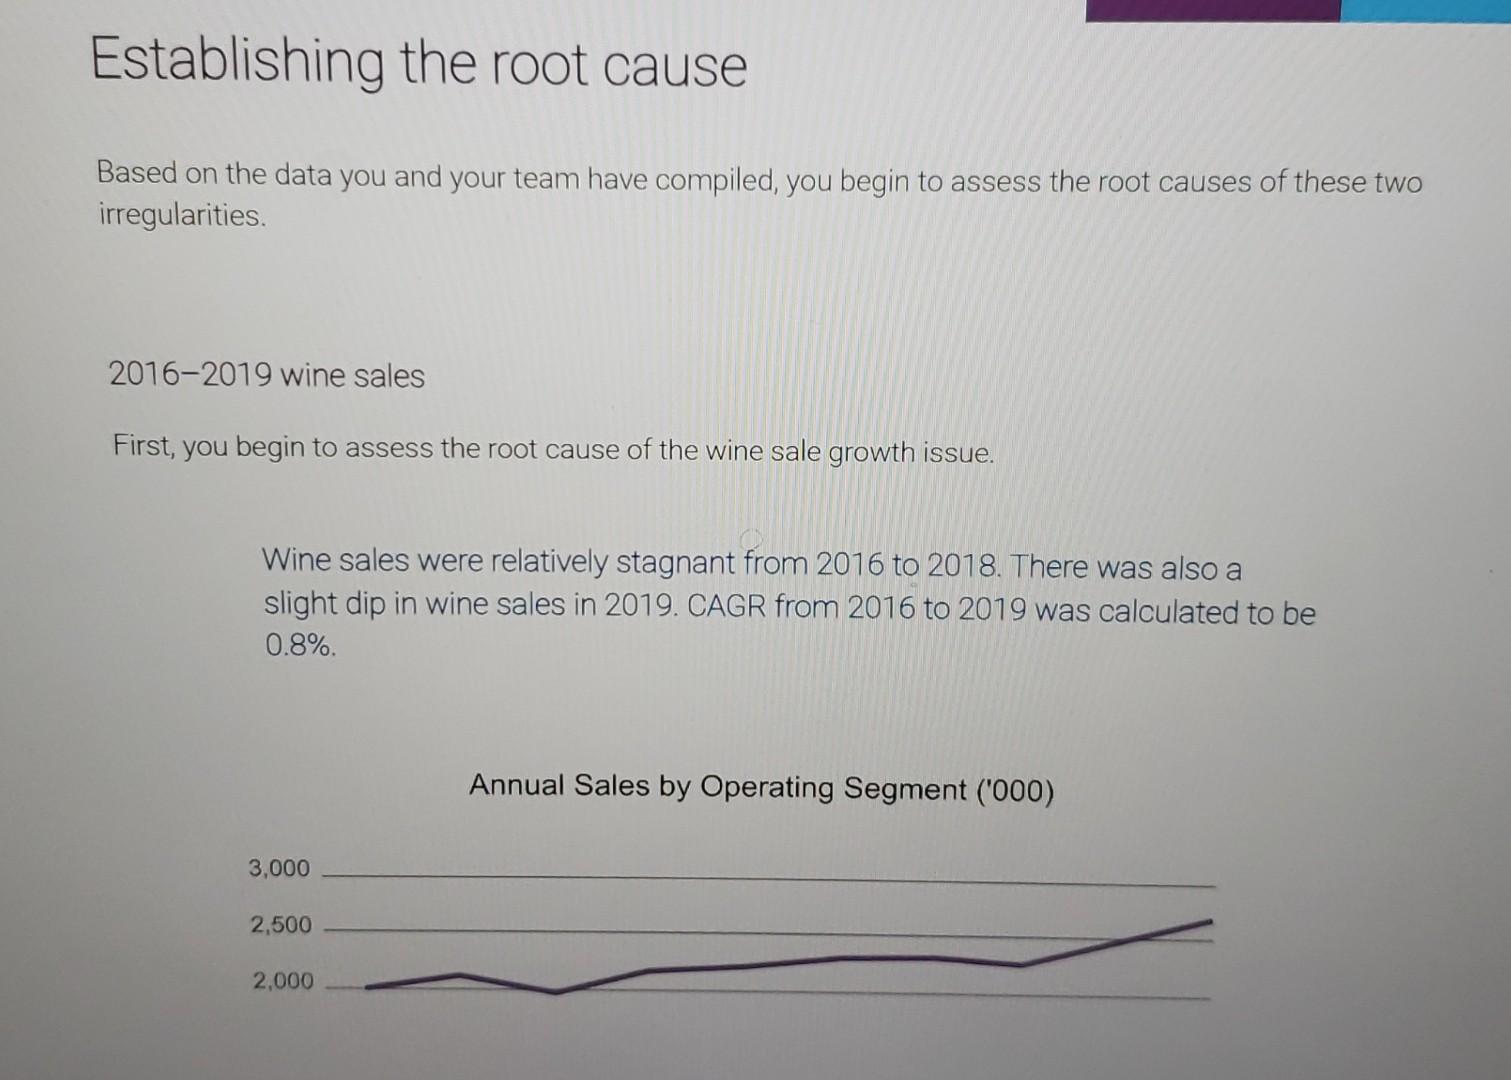
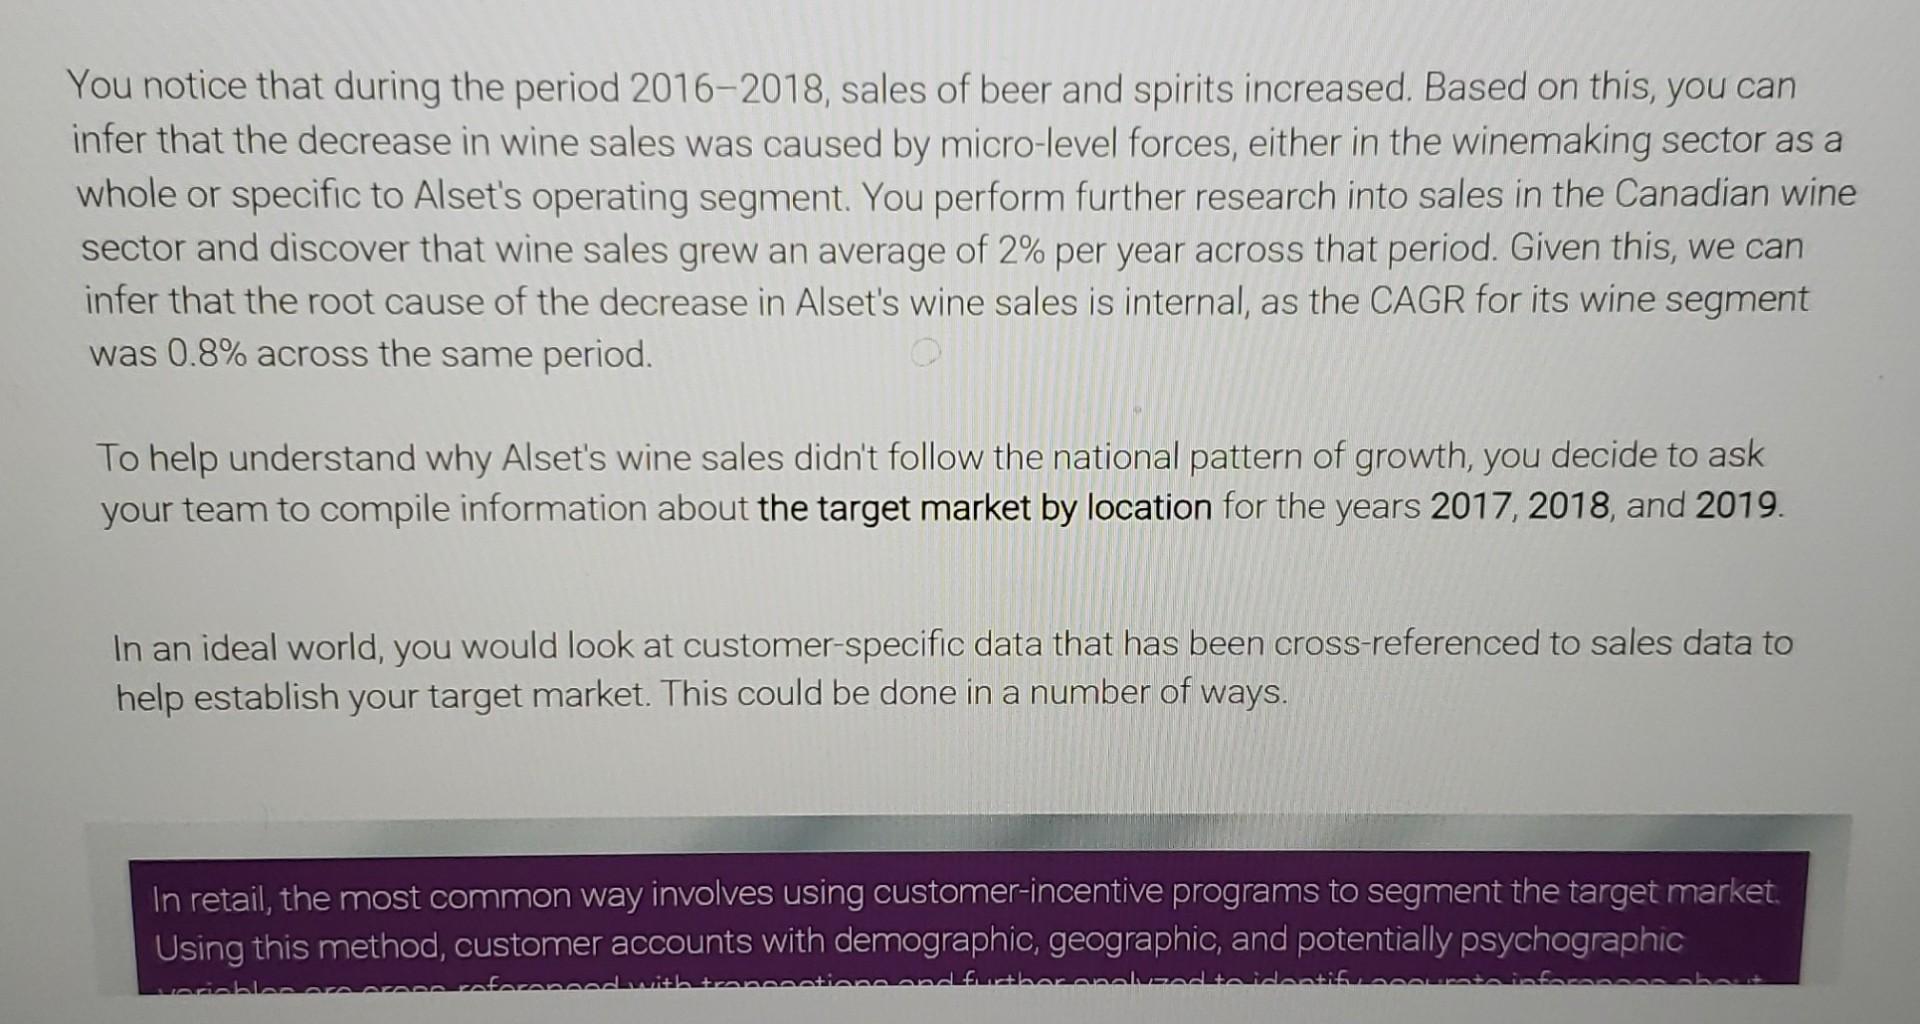
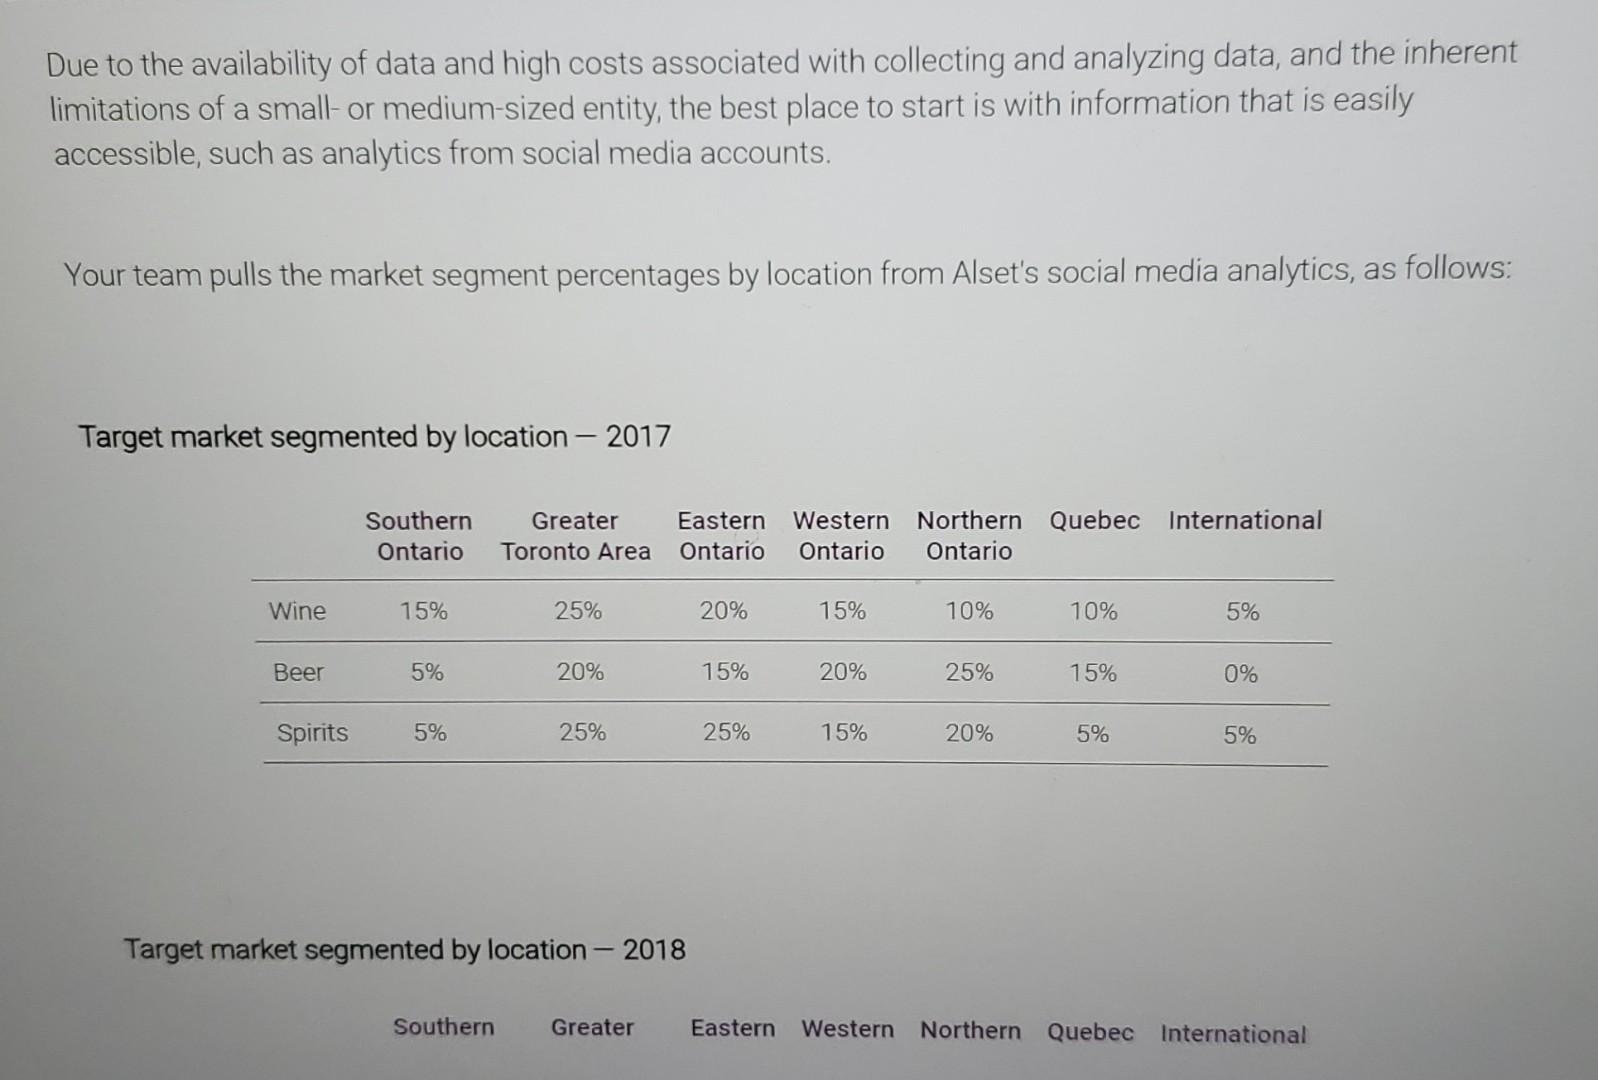
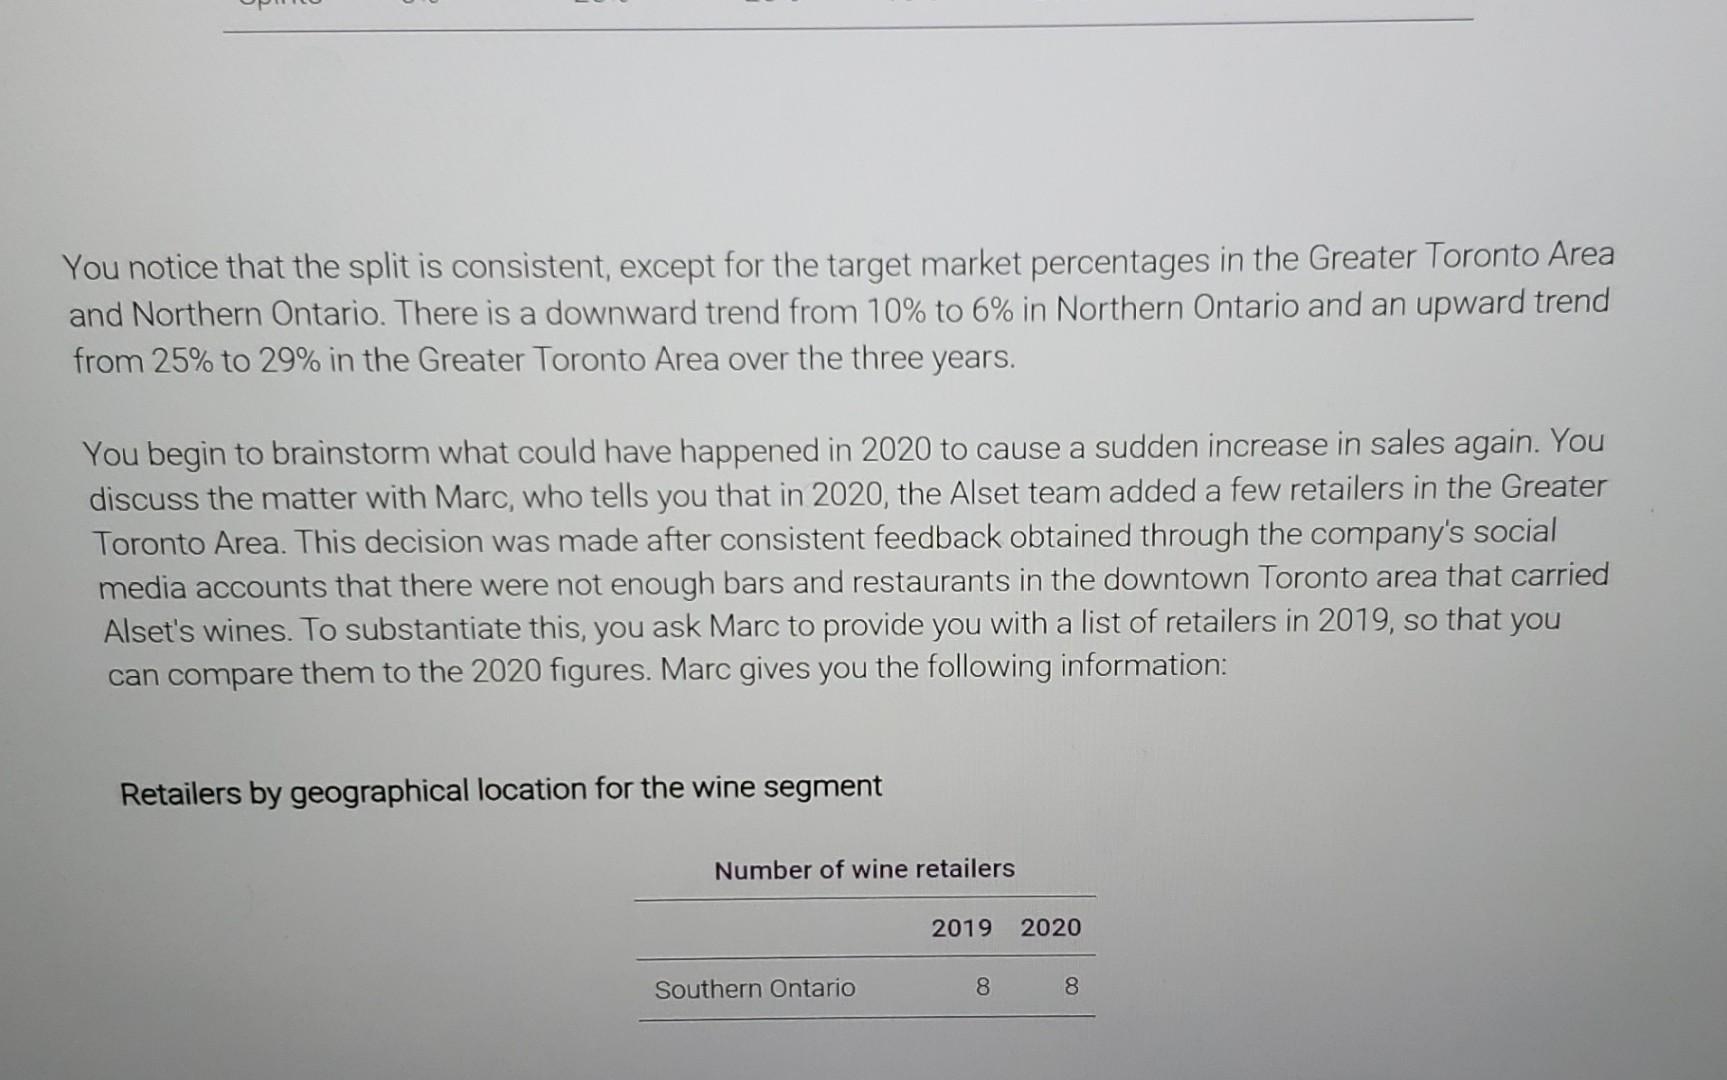
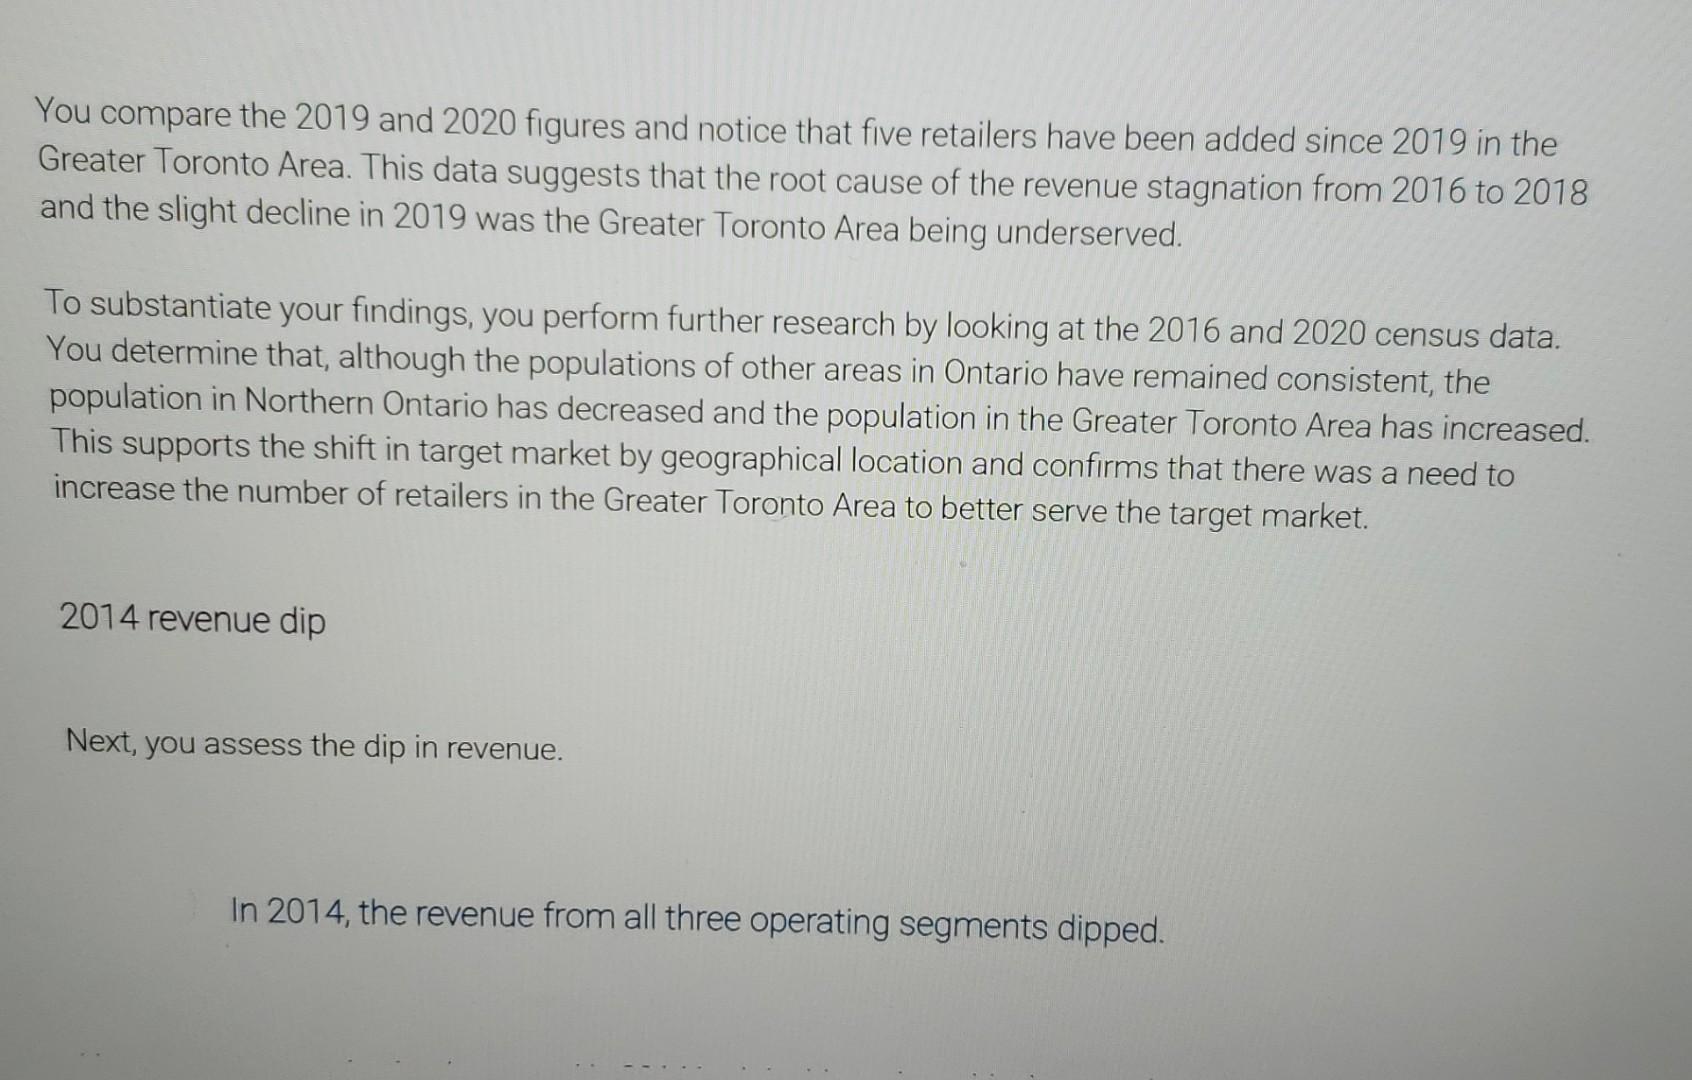
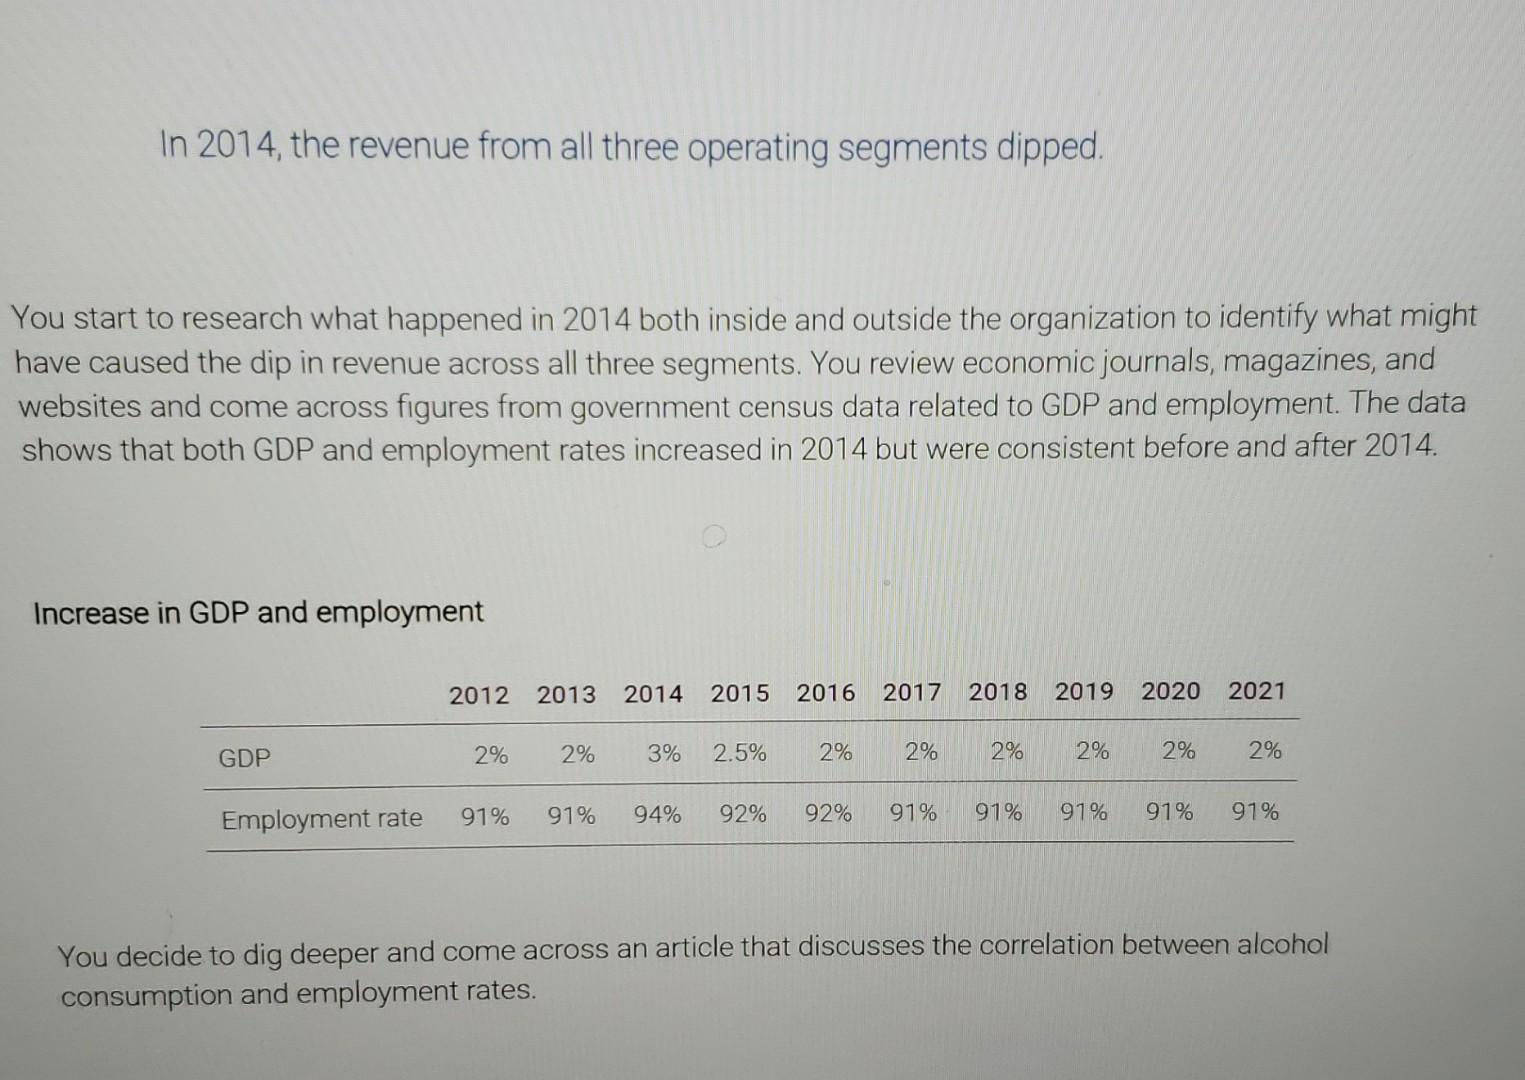
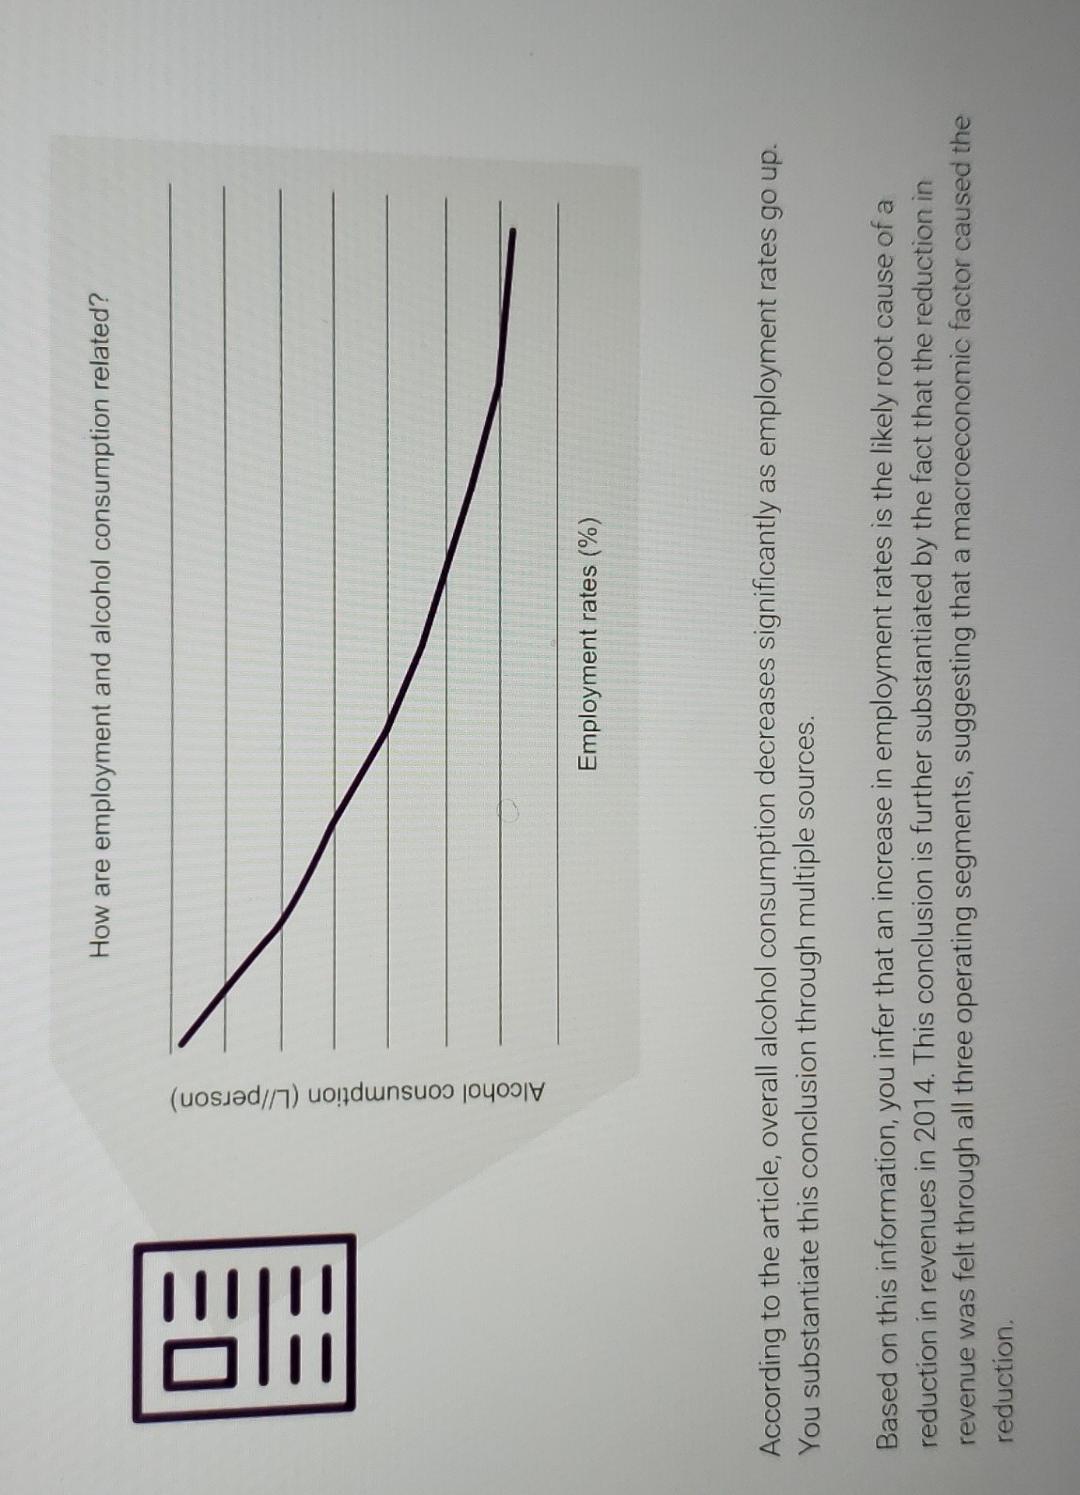
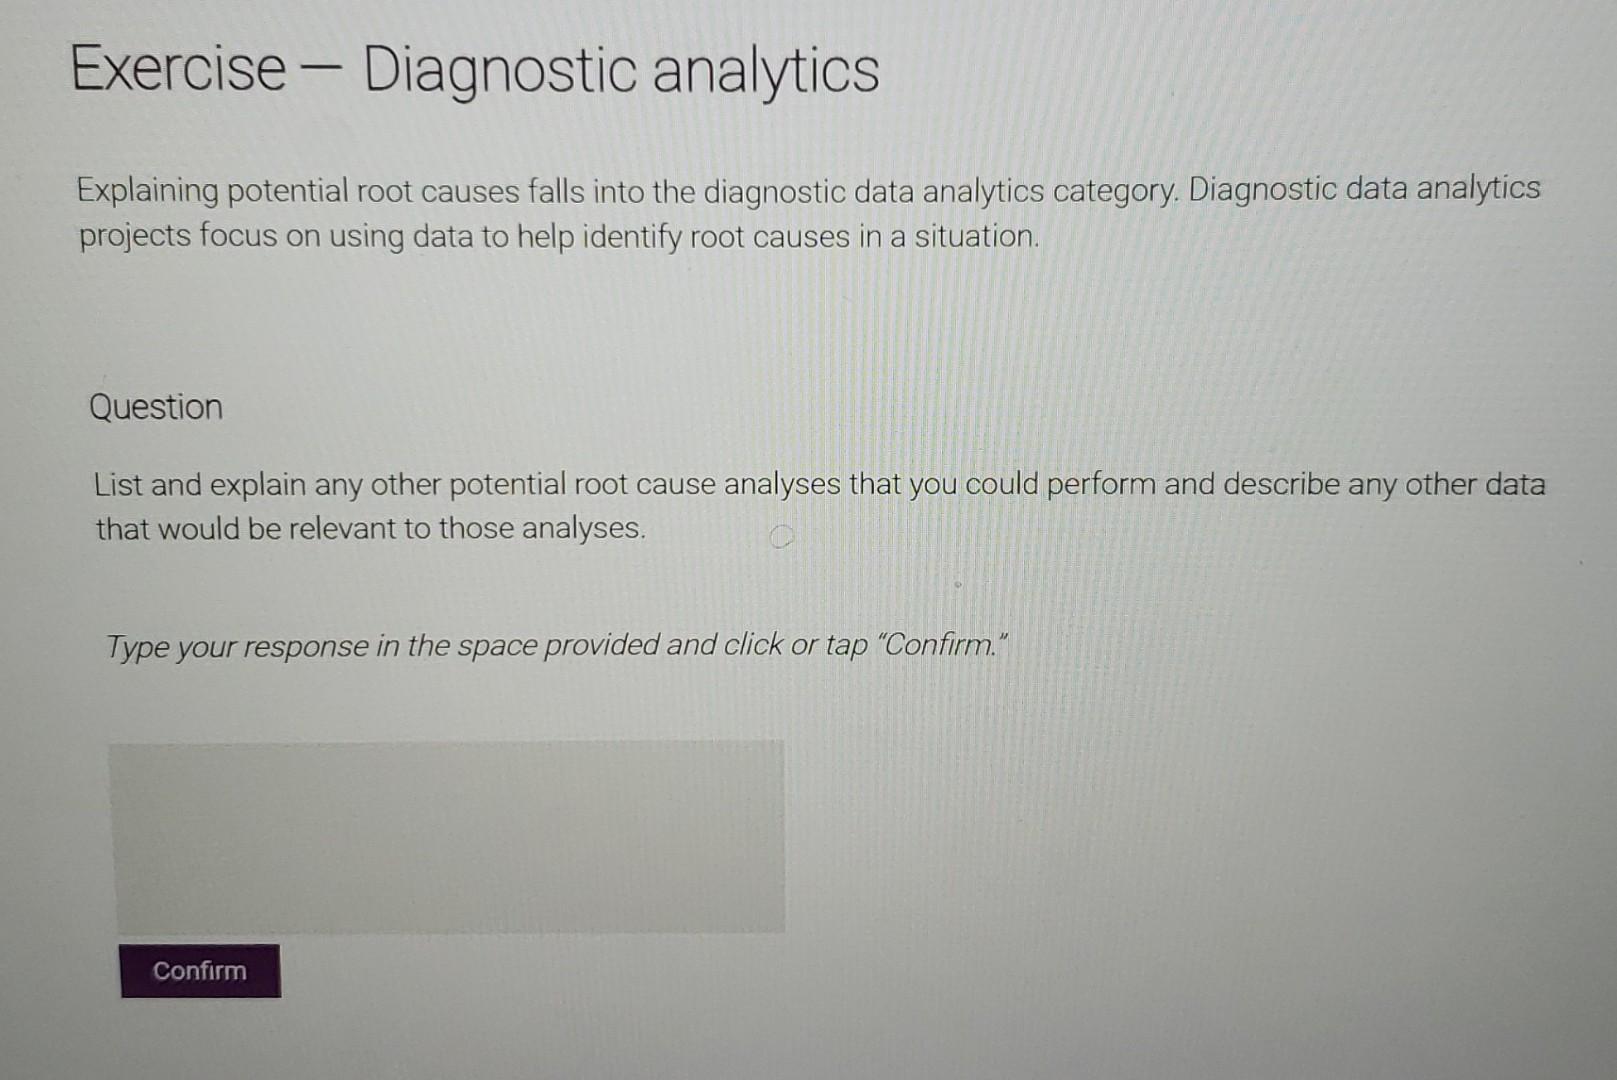
Based on the data you and your team have compiled, you begin to assess the root causes of these two irregularities. 2016-2019 wine sales First, you begin to assess the root cause of the wine sale growth issue. Wine sales were relatively stagnant from 2016 to 2018 . There was also a slight dip in wine sales in 2019. CAGR from 2016 to 2019 was calculated to be 0.8%. Annual Sales by Operating Segment ('000) 3,000 Annual Sales by Operating Segment ('000) You notice that during the period 2016-2018, sales of beer and spirits increased. Based on this, you can infer that the decrease in wine sales was caused by micro-level forces, either in the winemaking sector as a whole or specific to Alset's operating segment. You perform further research into sales in the Canadian wine sector and discover that wine sales grew an average of 2% per year across that period. Given this, we can infer that the root cause of the decrease in Alset's wine sales is internal, as the CAGR for its wine segment was 0.8% across the same period. To help understand why Alset's wine sales didn't follow the national pattern of growth, you decide to ask your team to compile information about the target market by location for the years 2017, 2018, and 2019. In an ideal world, you would look at customer-specific data that has been cross-referenced to sales data to help establish your target market. This could be done in a number of ways. Due to the availability of data and high costs associated with collecting and analyzing data, and the inherent limitations of a small- or medium-sized entity, the best place to start is with information that is easily accessible, such as analytics from social media accounts. Your team pulls the market segment percentages by location from Alset's social media analytics, as follows: Target market segmented by location - 2017 Target market segmented by location - 2018 Target market segmented by location - 2018 Target market segmented by location - 2019 You notice that the split is consistent, except for the target market percentages in the Greater Toronto Area and Northern Ontario. There is a downward trend from 10% to 6% in Northern Ontario and an upward trend from 25% to 29% in the Greater Toronto Area over the three years. You begin to brainstorm what could have happened in 2020 to cause a sudden increase in sales again. You discuss the matter with Marc, who tells you that in 2020, the Alset team added a few retailers in the Greater Toronto Area. This decision was made after consistent feedback obtained through the company's social media accounts that there were not enough bars and restaurants in the downtown Toronto area that carried Alset's wines. To substantiate this, you ask Marc to provide you with a list of retailers in 2019, so that you can compare them to the 2020 figures. Marc gives you the following information: Retailers by geographical location for the wine segment You compare the 2019 and 2020 figures and notice that five retailers have been added since 2019 in the Greater Toronto Area. This data suggests that the root cause of the revenue stagnation from 2016 to 2018 and the slight decline in 2019 was the Greater Toronto Area being underserved. To substantiate your findings, you perform further research by looking at the 2016 and 2020 census data. You determine that, although the populations of other areas in Ontario have remained consistent, the population in Northern Ontario has decreased and the population in the Greater Toronto Area has increased. This supports the shift in target market by geographical location and confirms that there was a need to increase the number of retailers in the Greater Toronto Area to better serve the target market. 2014 revenue dip Next, you assess the dip in revenue. In 2014, the revenue from all three operating segments dipped. You start to research what happened in 2014 both inside and outside the organization to identify what might have caused the dip in revenue across all three segments. You review economic journals, magazines, and websites and come across figures from government census data related to GDP and employment. The data shows that both GDP and employment rates increased in 2014 but were consistent before and after 2014. Increase in GDP and employment You decide to dig deeper and come across an article that discusses the correlation between alcohol consumntion and emnlovment rates. Explaining potential root causes falls into the diagnostic data analytics category. Diagnostic data analytics projects focus on using data to help identify root causes in a situation. Question List and explain any other potential root cause analyses that you could perform and describe any other data that would be relevant to those analyses. Type your response in the space provided and click or tap "Confirm." Based on the data you and your team have compiled, you begin to assess the root causes of these two irregularities. 2016-2019 wine sales First, you begin to assess the root cause of the wine sale growth issue. Wine sales were relatively stagnant from 2016 to 2018 . There was also a slight dip in wine sales in 2019. CAGR from 2016 to 2019 was calculated to be 0.8%. Annual Sales by Operating Segment ('000) You notice that during the period 2016-2018, sales of beer and spirits increased. Based on this, you can infer that the decrease in wine sales was caused by micro-level forces, either in the winemaking sector as a whole or specific to Alset's operating segment. You perform further research into sales in the Canadian wine sector and discover that wine sales grew an average of 2% per year across that period. Given this, we can infer that the root cause of the decrease in Alset's wine sales is internal, as the CAGR for its wine segment was 0.8% across the same period. To help understand why Alset's wine sales didn't follow the national pattern of growth, you decide to ask your team to compile information about the target market by location for the years 2017, 2018, and 2019. In an ideal world, you would look at customer-specific data that has been cross-referenced to sales data to help establish your target market. This could be done in a number of ways. In retail, the most common way involves using customer-incentive programs to segment the target market. Using this method, customer accounts with demographic, geographic, and potentially psychographic Due to the availability of data and high costs associated with collecting and analyzing data, and the inherent limitations of a small- or medium-sized entity, the best place to start is with information that is easily accessible, such as analytics from social media accounts. Your team pulls the market segment percentages by location from Alset's social media analytics, as follows: Target market segmented by location - 2017 Target market segmented by location - 2018 Eastern Western Northern Quebec You notice that the split is consistent, except for the target market percentages in the Greater Toronto Area and Northern Ontario. There is a downward trend from 10\% to 6% in Northern Ontario and an upward trend from 25% to 29% in the Greater Toronto Area over the three years. You begin to brainstorm what could have happened in 2020 to cause a sudden increase in sales again. You discuss the matter with Marc, who tells you that in 2020, the Alset team added a few retailers in the Greater Toronto Area. This decision was made after consistent feedback obtained through the company's social media accounts that there were not enough bars and restaurants in the downtown Toronto area that carried Alset's wines. To substantiate this, you ask Marc to provide you with a list of retailers in 2019, so that you can compare them to the 2020 figures. Marc gives you the following information: Retailers by qeographical location for the wine segment You compare the 2019 and 2020 figures and notice that five retailers have been added since 2019 in the Greater Toronto Area. This data suggests that the root cause of the revenue stagnation from 2016 to 2018 and the slight decline in 2019 was the Greater Toronto Area being underserved. To substantiate your findings, you perform further research by looking at the 2016 and 2020 census data. You determine that, although the populations of other areas in Ontario have remained consistent, the population in Northern Ontario has decreased and the population in the Greater Toronto Area has increased. This supports the shift in target market by geographical location and confirms that there was a need to increase the number of retailers in the Greater Toronto Area to better serve the target market. 2014 revenue dip Next, you assess the dip in revenue. In 2014, the revenue from all three operating segments dipped. In 2014, the revenue from all three operating segments dipped. You start to research what happened in 2014 both inside and outside the organization to identify what might have caused the dip in revenue across all three segments. You review economic journals, magazines, and websites and come across figures from government census data related to GDP and employment. The data shows that both GDP and employment rates increased in 2014 but were consistent before and after 2014. Increase in GDP and employment You decide to dig deeper and come across an article that discusses the correlation between alcohol consumption and employment rates. How are employment and alcohol consumption related? According to the article, overall alcohol consumption decreases significantly as employment rates go up. You substantiate this conclusion through multiple sources. Based on this information, you infer that an increase in employment rates is the likely root cause of a reduction in revenues in 2014 . This conclusion is further substantiated by the fact that the reduction in revenue was felt through all three operating segments, suggesting that a macroeconomic factor caused the reduction. Explaining potential root causes falls into the diagnostic data analytics category. Diagnostic data analytics projects focus on using data to help identify root causes in a situation. Question List and explain any other potential root cause analyses that you could perform and describe any other data that would be relevant to those analyses. Type your response in the space provided and click or tap "ConfirmStep by Step Solution
There are 3 Steps involved in it
Step: 1

Get Instant Access to Expert-Tailored Solutions
See step-by-step solutions with expert insights and AI powered tools for academic success
Step: 2

Step: 3

Ace Your Homework with AI
Get the answers you need in no time with our AI-driven, step-by-step assistance
Get Started


