Attached is the 2013-2014 audit for a hospital tenant. The tenant will pay $3,309,300 in annual rent on the building we purchase. Can you please tell us if this is an acceptable tenant and why by summarizing your financial analysis in bullet points or a few paragraphs? Please provide any calculations you used in your analysis as well.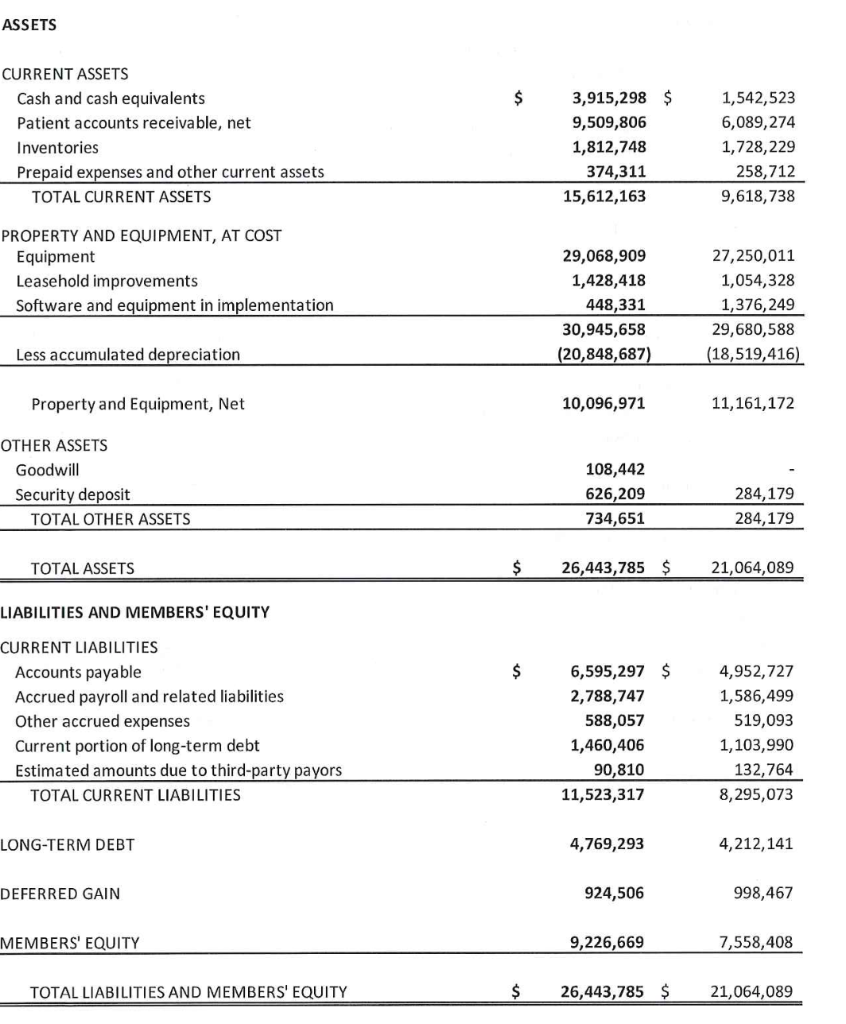
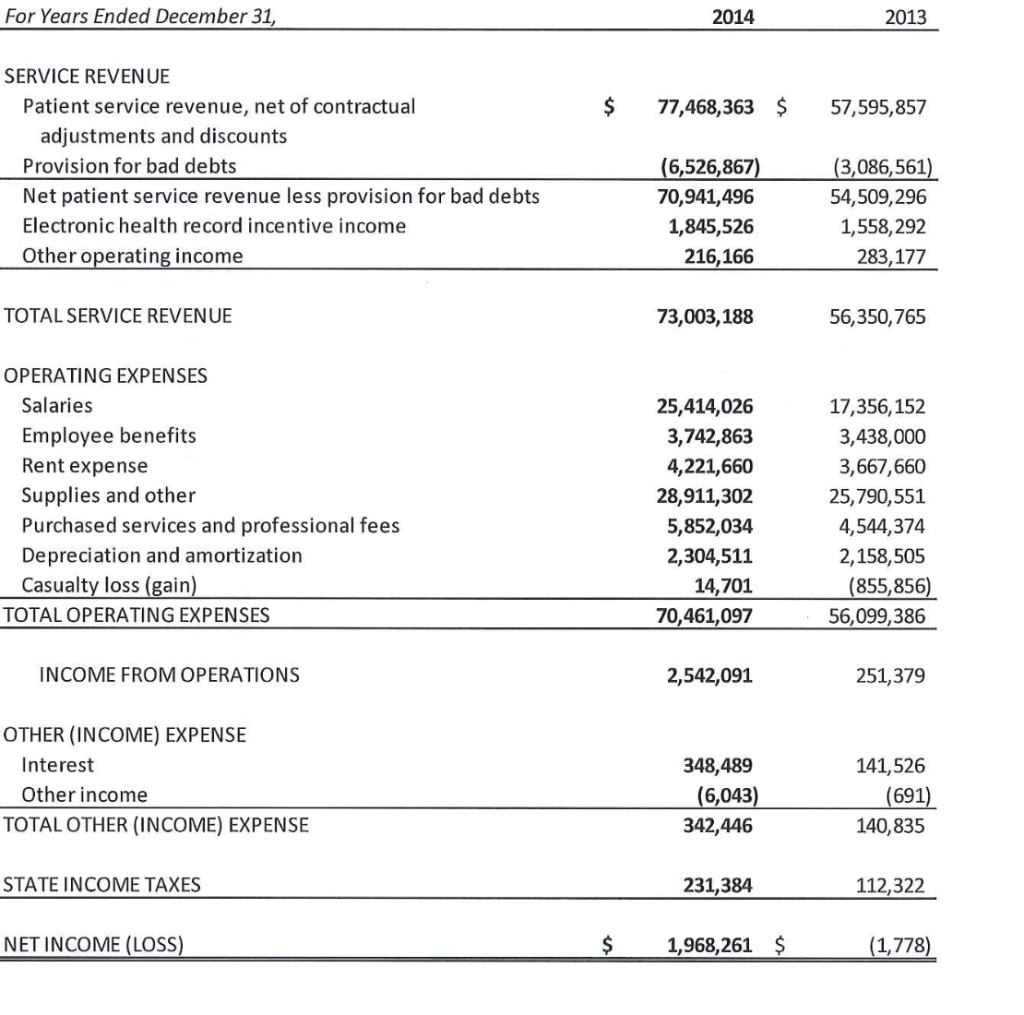
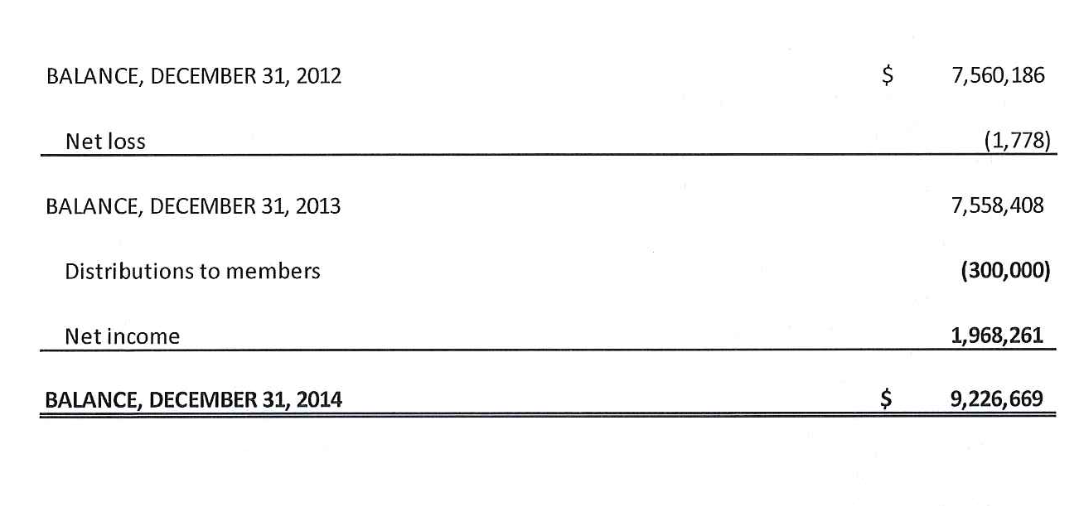
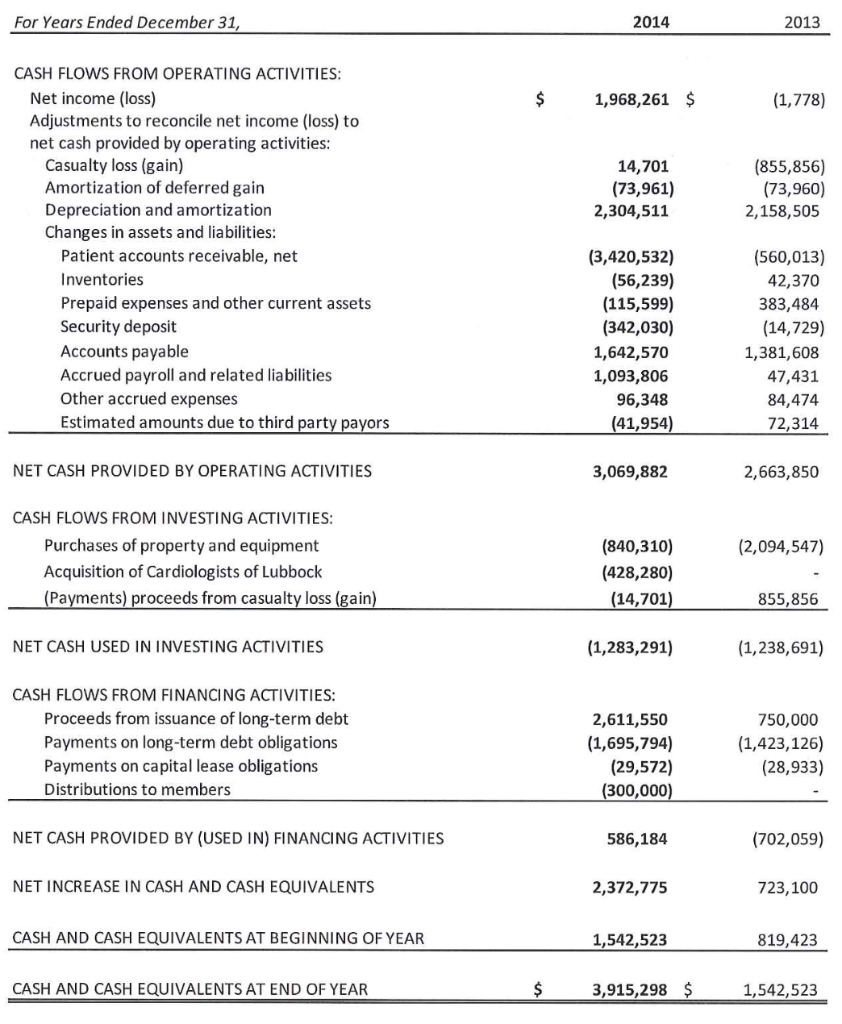
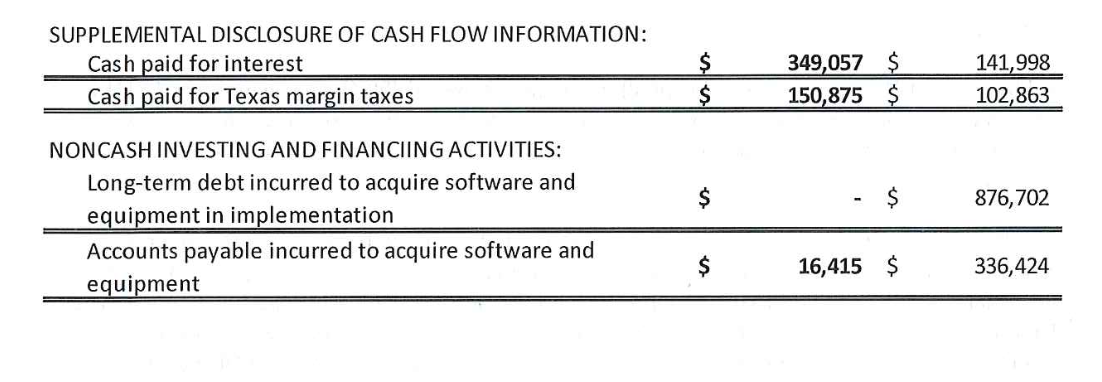
ASSETS $ CURRENT ASSETS Cash and cash equivalents Patient accounts receivable, net Inventories Prepaid expenses and other current assets TOTAL CURRENT ASSETS 3,915,298 $ 9,509,806 1,812,748 374,311 15,612,163 1,542,523 6,089,274 1,728, 229 258,712 9,618,738 PROPERTY AND EQUIPMENT, AT COST Equipment Leasehold improvements Software and equipment in implementation 29,068,909 1,428,418 448,331 30,945,658 (20,848,687) 27,250,011 1,054,328 1,376,249 29,680,588 (18,519,416) Less accumulated depreciation Property and Equipment, Net 10,096,971 11,161,172 OTHER ASSETS Goodwill Security deposit TOTAL OTHER ASSETS 108,442 626,209 734,651 284,179 284,179 TOTAL ASSETS $ 26,443,785 $ 21,064,089 LIABILITIES AND MEMBERS' EQUITY $ CURRENT LIABILITIES Accounts payable Accrued payroll and related liabilities Other accrued expenses Current portion of long-term debt Estimated amounts due to third-party payors TOTAL CURRENT LIABILITIES 6,595,297 $ 2,788,747 588,057 1,460,406 90,810 11,523,317 4,952,727 1,586,499 519,093 1,103,990 132,764 8,295,073 LONG-TERM DEBT 4,769,293 4,212,141 DEFERRED GAIN 924,506 998,467 MEMBERS' EQUITY 9,226,669 7,558,408 TOTAL LIABILITIES AND MEMBERS' EQUITY $ 26,443,785 $ 21,064,089 For Years Ended December 31, 2014 2013 $ 77,468,363 $ 57,595,857 SERVICE REVENUE Patient service revenue, net of contractual adjustments and discounts Provision for bad debts Net patient service revenue less provision for bad debts Electronic health record incentive income Other operating income (6,526,867) 70,941,496 1,845,526 216,166 (3,086,561) 54,509,296 1,558,292 283,177 TOTAL SERVICE REVENUE 73,003,188 56,350, 765 OPERATING EXPENSES Salaries Employee benefits Rent expense Supplies and other Purchased services and professional fees Depreciation and amortization Casualty loss (gain) TOTAL OPERATING EXPENSES 25,414,026 3,742,863 4,221,660 28,911,302 5,852,034 2,304,511 14,701 70,461,097 17,356,152 3,438,000 3,667,660 25,790,551 4,544,374 2,158,505 (855,856) 56,099,386 INCOME FROM OPERATIONS 2,542,091 251,379 OTHER (INCOME) EXPENSE Interest Other income TOTAL OTHER (INCOME) EXPENSE 348,489 (6,043) 342,446 141,526 (691) 140,835 STATE INCOME TAXES 231,384 112,322 NET INCOME (LOSS) $ 1,968,261 $ (1,778) BALANCE, DECEMBER 31, 2012 $ 7,560, 186 Net loss (1,778) BALANCE, DECEMBER 31, 2013 7,558,408 Distributions to members (300,000) Net income 1,968,261 BALANCE, DECEMBER 31, 2014 $ 9,226,669 For Years Ended December 31, 2014 2013 $ 1,968,261 $ (1,778) 14,701 (73,961) 2,304,511 (855,856) (73,960) 2,158,505 CASH FLOWS FROM OPERATING ACTIVITIES: Net income (loss) Adjustments to reconcile net income (loss) to net cash provided by operating activities: Casualty loss (gain) Amortization of deferred gain Depreciation and amortization Changes in assets and liabilities: Patient accounts receivable, net Inventories Prepaid expenses and other current assets Security deposit Accounts payable Accrued payroll and related liabilities Other accrued expenses Estimated amounts due to third party payors (3,420,532) (56,239) (115,599) (342,030) 1,642,570 1,093,806 96,348 (41,954) (560,013) 42,370 383,484 (14,729) 1,381,608 47,431 84,474 72,314 NET CASH PROVIDED BY OPERATING ACTIVITIES 3,069,882 2,663,850 (2,094,547) CASH FLOWS FROM INVESTING ACTIVITIES: Purchases of property and equipment Acquisition of Cardiologists of Lubbock (Payments) proceeds from casualty loss (gain) (840,310) (428,280) (14,701) 855,856 NET CASH USED IN INVESTING ACTIVITIES (1,283,291) (1,238,691) CASH FLOWS FROM FINANCING ACTIVITIES: Proceeds from issuance of long-term debt Payments on long-term debt obligations Payments on capital lease obligations Distributions to members 2,611,550 (1,695,794) (29,572) (300,000) 750,000 (1,423,126) (28,933) NET CASH PROVIDED BY (USED IN) FINANCING ACTIVITIES 586,184 (702,059) NET INCREASE IN CASH AND CASH EQUIVALENTS 2,372,775 723,100 CASH AND CASH EQUIVALENTS AT BEGINNING OF YEAR 1,542,523 819,423 CASH AND CASH EQUIVALENTS AT END OF YEAR $ 3,915,298 $ 1,542,523 SUPPLEMENTAL DISCLOSURE OF CASH FLOW INFORMATION: Cash paid for interest Cash paid for Texas margin taxes $ $ 349,057 $ 150,875 $ 141,998 102,863 $ 876,702 NONCASH INVESTING AND FINANCIING ACTIVITIES: Long-term debt incurred to acquire software and equipment in implementation Accounts payable incurred to acquire software and equipment $ 16,415 $ 336,424 ASSETS $ CURRENT ASSETS Cash and cash equivalents Patient accounts receivable, net Inventories Prepaid expenses and other current assets TOTAL CURRENT ASSETS 3,915,298 $ 9,509,806 1,812,748 374,311 15,612,163 1,542,523 6,089,274 1,728, 229 258,712 9,618,738 PROPERTY AND EQUIPMENT, AT COST Equipment Leasehold improvements Software and equipment in implementation 29,068,909 1,428,418 448,331 30,945,658 (20,848,687) 27,250,011 1,054,328 1,376,249 29,680,588 (18,519,416) Less accumulated depreciation Property and Equipment, Net 10,096,971 11,161,172 OTHER ASSETS Goodwill Security deposit TOTAL OTHER ASSETS 108,442 626,209 734,651 284,179 284,179 TOTAL ASSETS $ 26,443,785 $ 21,064,089 LIABILITIES AND MEMBERS' EQUITY $ CURRENT LIABILITIES Accounts payable Accrued payroll and related liabilities Other accrued expenses Current portion of long-term debt Estimated amounts due to third-party payors TOTAL CURRENT LIABILITIES 6,595,297 $ 2,788,747 588,057 1,460,406 90,810 11,523,317 4,952,727 1,586,499 519,093 1,103,990 132,764 8,295,073 LONG-TERM DEBT 4,769,293 4,212,141 DEFERRED GAIN 924,506 998,467 MEMBERS' EQUITY 9,226,669 7,558,408 TOTAL LIABILITIES AND MEMBERS' EQUITY $ 26,443,785 $ 21,064,089 For Years Ended December 31, 2014 2013 $ 77,468,363 $ 57,595,857 SERVICE REVENUE Patient service revenue, net of contractual adjustments and discounts Provision for bad debts Net patient service revenue less provision for bad debts Electronic health record incentive income Other operating income (6,526,867) 70,941,496 1,845,526 216,166 (3,086,561) 54,509,296 1,558,292 283,177 TOTAL SERVICE REVENUE 73,003,188 56,350, 765 OPERATING EXPENSES Salaries Employee benefits Rent expense Supplies and other Purchased services and professional fees Depreciation and amortization Casualty loss (gain) TOTAL OPERATING EXPENSES 25,414,026 3,742,863 4,221,660 28,911,302 5,852,034 2,304,511 14,701 70,461,097 17,356,152 3,438,000 3,667,660 25,790,551 4,544,374 2,158,505 (855,856) 56,099,386 INCOME FROM OPERATIONS 2,542,091 251,379 OTHER (INCOME) EXPENSE Interest Other income TOTAL OTHER (INCOME) EXPENSE 348,489 (6,043) 342,446 141,526 (691) 140,835 STATE INCOME TAXES 231,384 112,322 NET INCOME (LOSS) $ 1,968,261 $ (1,778) BALANCE, DECEMBER 31, 2012 $ 7,560, 186 Net loss (1,778) BALANCE, DECEMBER 31, 2013 7,558,408 Distributions to members (300,000) Net income 1,968,261 BALANCE, DECEMBER 31, 2014 $ 9,226,669 For Years Ended December 31, 2014 2013 $ 1,968,261 $ (1,778) 14,701 (73,961) 2,304,511 (855,856) (73,960) 2,158,505 CASH FLOWS FROM OPERATING ACTIVITIES: Net income (loss) Adjustments to reconcile net income (loss) to net cash provided by operating activities: Casualty loss (gain) Amortization of deferred gain Depreciation and amortization Changes in assets and liabilities: Patient accounts receivable, net Inventories Prepaid expenses and other current assets Security deposit Accounts payable Accrued payroll and related liabilities Other accrued expenses Estimated amounts due to third party payors (3,420,532) (56,239) (115,599) (342,030) 1,642,570 1,093,806 96,348 (41,954) (560,013) 42,370 383,484 (14,729) 1,381,608 47,431 84,474 72,314 NET CASH PROVIDED BY OPERATING ACTIVITIES 3,069,882 2,663,850 (2,094,547) CASH FLOWS FROM INVESTING ACTIVITIES: Purchases of property and equipment Acquisition of Cardiologists of Lubbock (Payments) proceeds from casualty loss (gain) (840,310) (428,280) (14,701) 855,856 NET CASH USED IN INVESTING ACTIVITIES (1,283,291) (1,238,691) CASH FLOWS FROM FINANCING ACTIVITIES: Proceeds from issuance of long-term debt Payments on long-term debt obligations Payments on capital lease obligations Distributions to members 2,611,550 (1,695,794) (29,572) (300,000) 750,000 (1,423,126) (28,933) NET CASH PROVIDED BY (USED IN) FINANCING ACTIVITIES 586,184 (702,059) NET INCREASE IN CASH AND CASH EQUIVALENTS 2,372,775 723,100 CASH AND CASH EQUIVALENTS AT BEGINNING OF YEAR 1,542,523 819,423 CASH AND CASH EQUIVALENTS AT END OF YEAR $ 3,915,298 $ 1,542,523 SUPPLEMENTAL DISCLOSURE OF CASH FLOW INFORMATION: Cash paid for interest Cash paid for Texas margin taxes $ $ 349,057 $ 150,875 $ 141,998 102,863 $ 876,702 NONCASH INVESTING AND FINANCIING ACTIVITIES: Long-term debt incurred to acquire software and equipment in implementation Accounts payable incurred to acquire software and equipment $ 16,415 $ 336,424