

Answered step by step
Verified Expert Solution
Question
1 Approved Answer
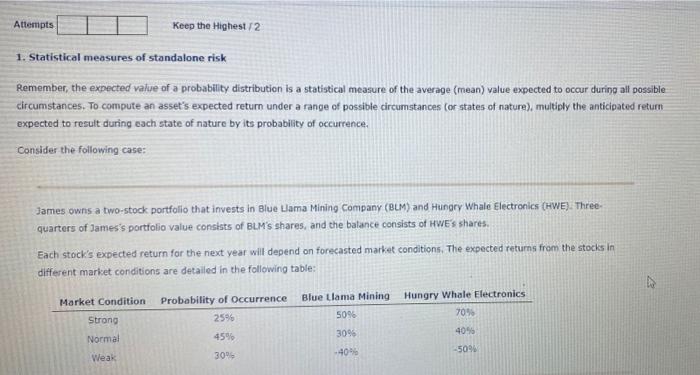
Attempts Keep the Highest 2 1. Statistical measures of standalone risk Remember , the expected value of a probability distribution is a statistical measure of
Step by Step Solution
There are 3 Steps involved in it
Step: 1

Get Instant Access to Expert-Tailored Solutions
See step-by-step solutions with expert insights and AI powered tools for academic success
Step: 2

Step: 3
Ace Your Homework with AI
Get the answers you need in no time with our AI-driven, step-by-step assistance
Get Started
Electronic Waste An Actual Gold And Silver Mine
Authors: Antonio Alcivar
1st Edition
979-8367641059