Answered step by step
Verified Expert Solution
Question
1 Approved Answer
ATTN: this is 1 question with parts A-E. Chegg Policy states that you must answer all parts of the question. Please answer all parts of
ATTN: this is 1 question with parts A-E. Chegg Policy states that you must answer all parts of the question. Please answer all parts of the question CORRECTLY with all STEPS and HOW it is stated to do for a thumbs up There are SEVERAL pictures for clarity. 


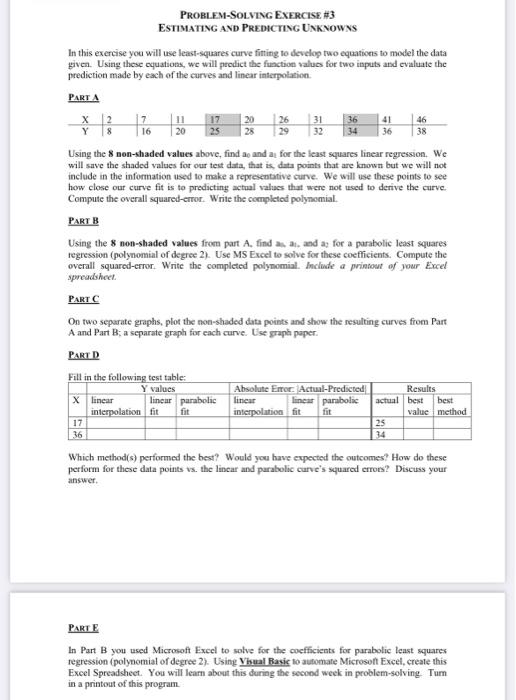
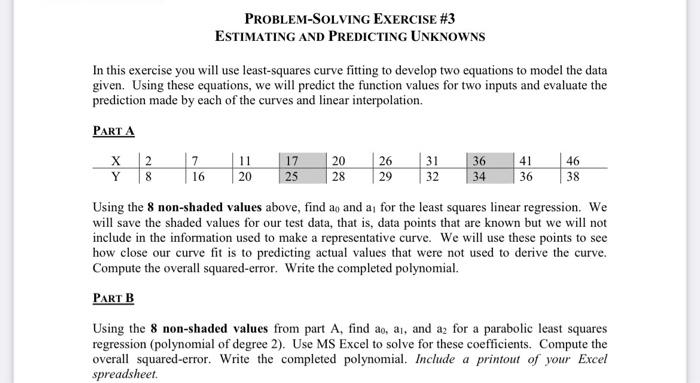
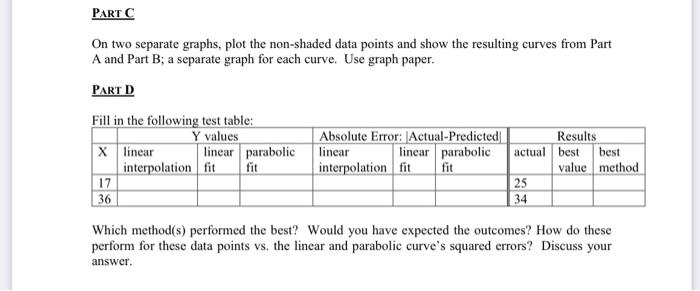
PROBLEM-SOLvivg EXERCISE H3 ESTIMATING AND PREDICTIVG UNKNOWNS In this exercise you will use least-squares curve fitting to develop two equations to model the data given. Using these equations, we will predict the function values for two inputs and evaluate the prediction made by each of the curves and linear interpolasion. PART A Using the 8 non-shaded values above, find a and at for the least squares linear regression. We will save the shaded values for our test data, that is, data points that are known but we will not include in the information used to make a representative curve. We will use these points to see how close our curve fit is to predicting actual values that were not used to derive the curve. Compute the overall squared-error. Write the completed polynomial. PART B Using the 8 non-shaded values from part A. find as an, and ay for a purabolic least squares regression (polynomial of degree 2). Use MS Excel to solve for these coefficients. Compute the overall squared-error. Write the completed polynomial. Anclude a prinhout of your Excel spreadshoet. PART C On two separate graphs, plot the non-shaded dita points and show the resulting curves from Part A and Part B; a separate graph for each curve. Uise graph paper. PART D Eell in the followimien tanet tahle- Which method(s) performed the best? Would you have expected the outcomes? How do these perform for these data points vs. the linear and parabolic curve's sequared erross? Discuss your answer. PARTE In Part B you used Microsoft Exeel to solve for the cocfficients for parabolic least squares regression (polynomial of degree 2). Using Vhual Rasic lo automate Microson Excel, create this Excel Spreadsheet. You will leam about this during the second week in problem-solving. Tum in a printout of this program. Problem-Solving EXERCISE \#3 ESTIMAting ANd Predicting UnKNowns In this exercise you will use least-squares curve fitting to develop two equations to model the data given. Using these equations, we will predict the function values for two inputs and evaluate the prediction made by each of the curves and linear interpolation. PART A Using the 8 non-shaded values above, find a0 and a1 for the least squares linear regression. We will save the shaded values for our test data, that is, data points that are known but we will not include in the information used to make a representative curve. We will use these points to see how close our curve fit is to predicting actual values that were not used to derive the curve. Compute the overall squared-error. Write the completed polynomial. PART B Using the 8 non-shaded values from part A, find a0,a1, and a2 for a parabolic least squares regression (polynomial of degree 2). Use MS Excel to solve for these coefficients. Compute the overall squared-error. Write the completed polynomial. Include a printout of your Excel spreadsheet. On two separate graphs, plot the non-shaded data points and show the resulting curves from Part A and Part B; a separate graph for each curve. Use graph paper. PART D Fill in the followina toet tahla. Which method(s) performed the best? Would you have expected the outcomes? How do these perform for these data points vs. the linear and parabolic curve's squared errors? Discuss your answer. In Part B you used Microsoft Excel to solve for the coefficients for parabolic least squares regression (polynomial of degree 2). Using Visual Basic to automate Microsoft Excel, create this Excel Spreadsheet. You will learn about this during the second week in problem-solving. Turn in a printout of this program 


Step by Step Solution
There are 3 Steps involved in it
Step: 1

Get Instant Access to Expert-Tailored Solutions
See step-by-step solutions with expert insights and AI powered tools for academic success
Step: 2

Step: 3

Ace Your Homework with AI
Get the answers you need in no time with our AI-driven, step-by-step assistance
Get Started


