Question: a)USING KINETIC WHAT WOULD BE THE value of K for each run? b) concentration of the dye of each run at time 0 c) concentration
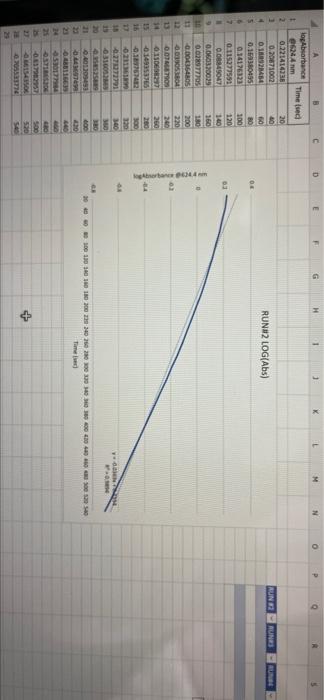
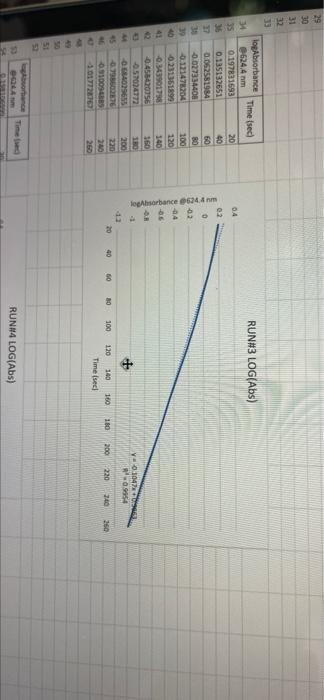
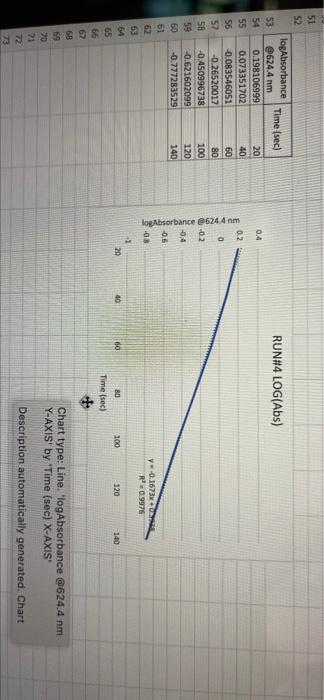
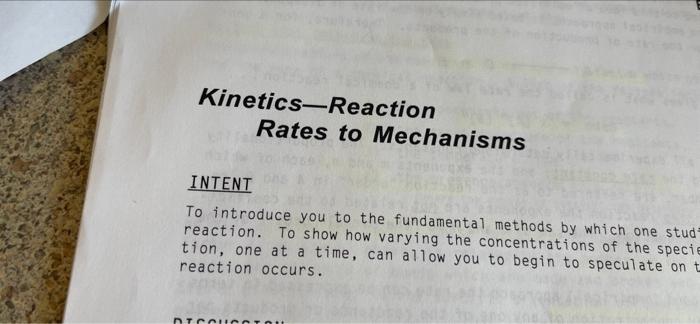
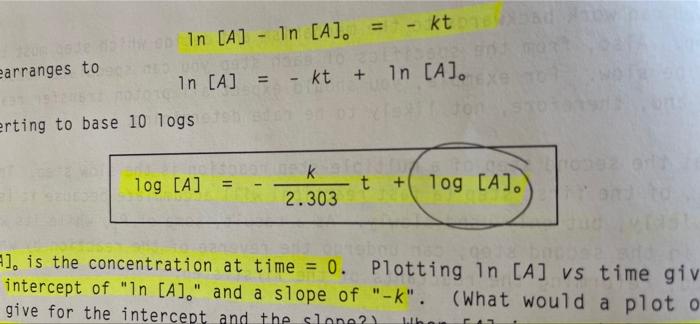
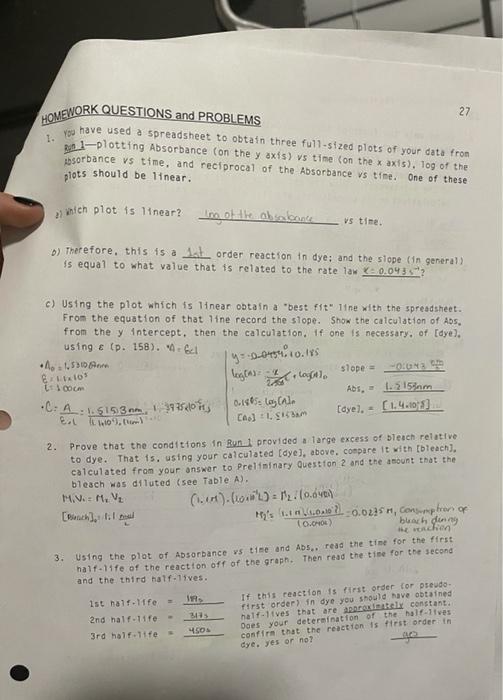
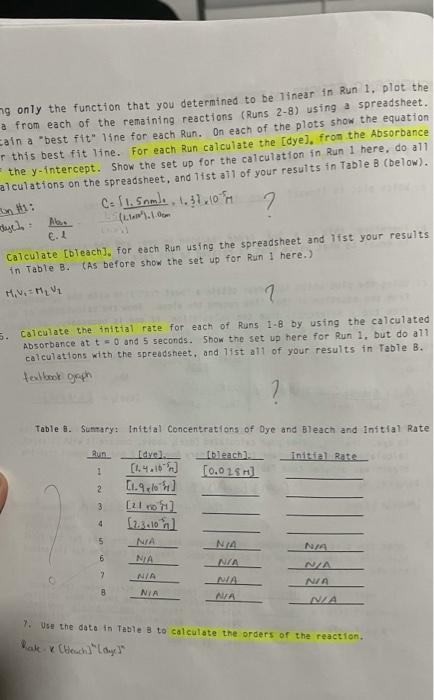
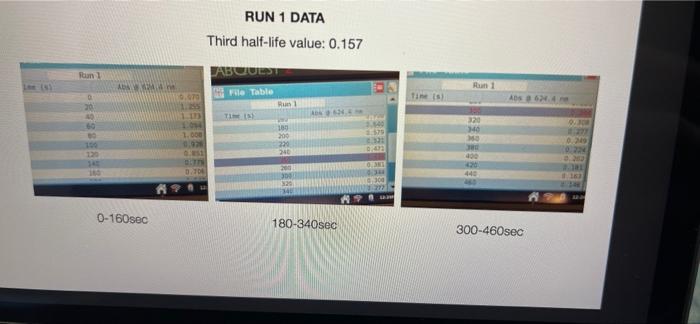
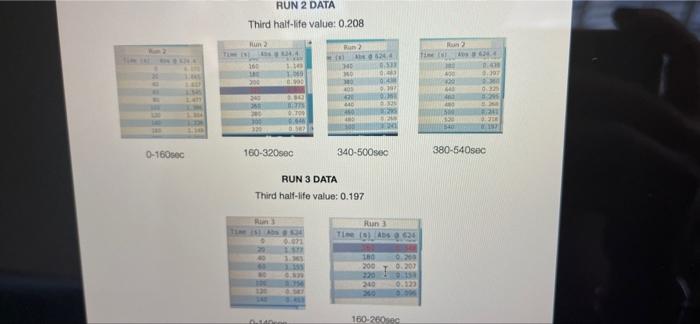
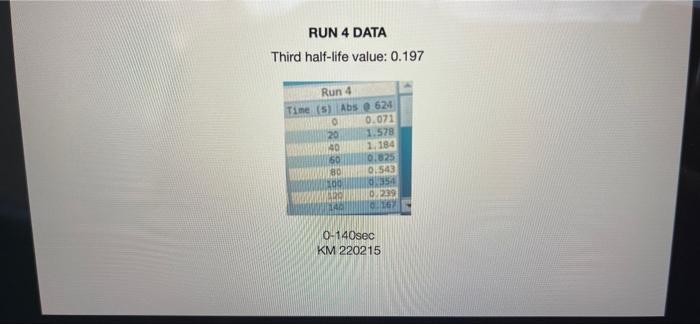
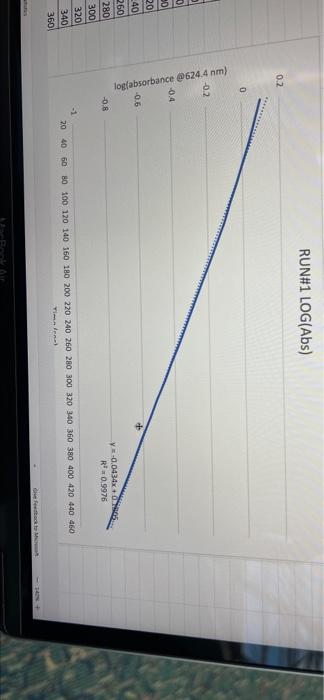
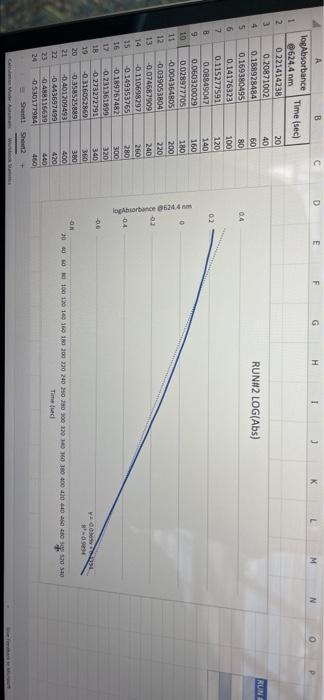
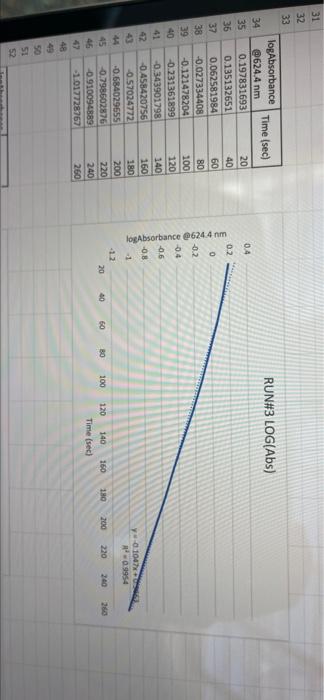
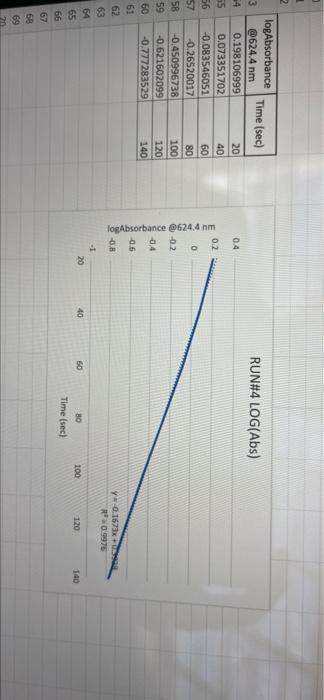
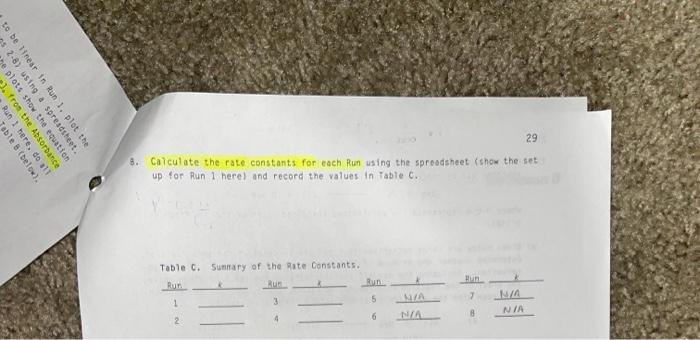
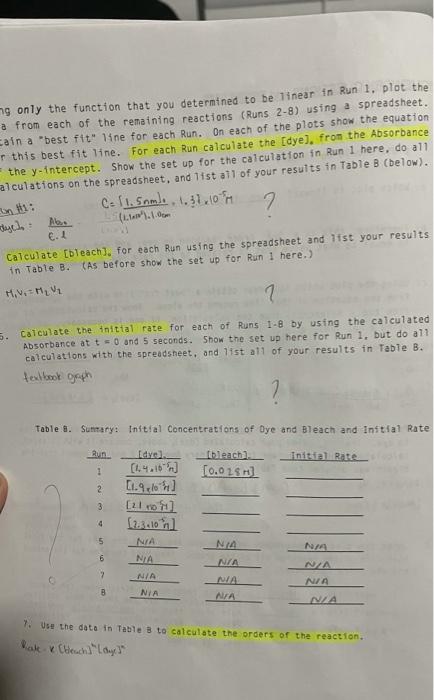
005 0.03792257 LO SE SETTO w OF Time) DO OBREDOK OOO SE BO ONE on otot 5 8 09.00 BARLETTO EGOCIOYO SESSED . 031 ro ODE 16 GENERICO (t 90 260 -0.14935315 015032 OOTA7909 IS CL NE ORE OOC OST EL SOLE000 SOCLORO LGSELTSITO 2 00 SOTOSEGATO 160 0.060320029 0.08849047 120 100 0.14176121 B0 0.13454 0.20671002 20 0.221414738 0624 Timesed lop Absorbance 5 () RUNU LOG(Abs) 4 09 OT RUNENUNES P 0 O N M 1 1 H H G D C. 30 31 32 RUN#3 LOG(Abs) 04 22 -02 log Absorbance 34 624.4 Time sech 35 0.197831593 20 36 0.135132651 40 1 0:052581984 60 35 -0.027334408 80 39 0.121476204 100 0.231361893 220 -0.343901798 140 42 -0.456420756 160 057024772 QE84029655 200 45 09860276 220 100SS 240 1.017720 fogsorbance 64 nm -04 v0.1047 . 13 20 40 SO 80 109 160 180 200 220 20 250 120 140 Time (sec 51 bort RUN#4 LOG(Abs) 51 52 RUN#4 LOG(Abs) 53 54 04 0.2 56 logAbsorbance Time (sec) 624.4 nm 0.198106999 20 0.073351702 40 -0.083546051 60 -0.26520017 80 -0.450996738 100 -0.621602099 120 -0.777283529 140 0 58 -02 log Absorbance 6244 am -0.4 -0,6 52 -08 V.0.1673x R 0.9976 BERG 8 8 8 8 8 8 8 SREB 20 40 10 64 65 80 100 120 140 Time (sec) + 68 69 70 Chart type: Line, 'logAbsorbance @624.4 nm Y-AXIS' by 'Time (sec) X-AXIS Description automatically generated. Chart 72 73 Kinetics-Reaction Rates to Mechanisms INTENT To introduce you to the fundamental methods by which one stud reaction. To show how varying the concentrations of the specie tion, one at a time, can allow you to begin to speculate ont reaction occurs. Con in [A] - In [A]. = - kt earranges to in [A] = - kt + ln [A). erting to base 10 logs 10g [A] = ak k 2.303 t + log [A]. =), is the concentration at time = 0. Plotting in [A] vs time giv intercept of "in [A]," and a slope of "-K". (What would a plot o give for the intercept and the slone?) 27 HOMEWORK QUESTIONS and PROBLEMS you have used as spreadsheet to obtain three fullsized plots of your data from al-plotting Absorbance (on the y axis) vs time (on the x axis), log of the sorbance vs time, and reciprocal of the Absorbance vs time. One of these plots should be linear. utch plot is linear? imobile ob sabonis Vs time. b) Therefore, this is a dat order reaction in dye; and the slope (in general) is equal to what value that is related to the rate law -0.0453"? c) Using the plot which is linear obtain a 'best fit" line with the spreadsheet. From the equation of that line record the slope. Show the calculation of Abs. from the y intercept, then the calculation. If one is necessary, of dye). using e (p. 158). 1.1 1.650 EXO Logo slope - 100CM Abs, I. 315am C: A. 15193350 Dis05: Local [dye). - [1.4.2008 8. 1. 10, LI. S4 Mi y= 0.0.1 legins 2. Prove that the conditions in Runt provided a large excess of bleuch relative to dye. That is using your calculated (dye), above. compare it with bleach). calculated from your answer to Preliminary Question 2 and the amount that the bleach was diluted (see Table A). MV.M.VE () (lMelodveh [ch] Ilmu Hy's St. 0.01 -0.0215M, comprar o TO.CHOE) buach duty kon 3. Using the plot of Absorbance vs time and Abs.. read the time for the first half-11e of the reaction off of the graph. Then read the time for the second and the third half-15ves. 1st half.11fe If this reaction is first order for pseudo first order) in dye you should have obtained 2nd half-life half-lives that are agreely constant. 3rd half-life 4.SOS Does your determination of the half-lives confirm that the reaction is first orders in dye. yes or no? - ng only the function that you determined to be linear in Run 1. plot the a from each of the remaining reactions (Runs 2-8) using a spreadsheet. cain a 'best fit" line for each Run. On each of the plots show the equation this best fit line. For each Run calculate the [dye), from the Absorbance the y-intercept. Show the set up for the calculation in Run 1 here, do all alculations on the spreadsheet, and list all of your results in Table B (below). C = 11.50ml 1.31. 101 2 (610). 1.000 E. Calculate [bleach), for each Run using the spreadsheet and list your results in Table B. As before show the set up for Run 1 here.) HIVI = M V2 2 wycle : Abi 5. Calculate the initial rate for each of Runs 1-8 by using the calculated Absorbance at t = 0 and 5 seconds. Show the set up here for Run 1, but do all calculations with the spreadsheet, and 11st all of your results in Table B. textbook graph 2 Table 8. Summary : Initial Concentrations of Dye and Bleach and initial Rate Run Initial Rate Ihleach (0.019 ] 1 2 3 [1.4.10 [1.9.16 ] [21 no ] (23.10 NA NA 4 5 NA 6 NIA 2 NIA NA NA NA NA ARA B NIA 1. Use the data in Table B to calculate the orders of the reaction. Rate & Obleach] Lage 3 RUN 1 DATA Third half-life value: 0.157 Lumi ABOUT File Table ADA Hunt A 64 30 09 w 320 340 1.00 1.000 100 200 2 1579 0.0 DEE 120 200 320 0.100 200 300 20 440 0-160sec 180-340sec 300-460sec RUN 2 DATA Third half-life value: 0.208 Hun 2 cum 19 HE 1 ORI 1. 0.100 OT . ON LED 34 ove w D 0-160sec 160-320sec 340-500sec 380-540sec RUN 3 DATA Third half-life value: 0.197 Hin 3 TA LO NE 333 153 10 200 0.202 220 200 0.123 WE 150-200 RUN 4 DATA Third half-life value: 0.197 Run 4 Time (5) Abs 624 0 0.071 20 1.578 40 1.184 50 0.825 0.543 100 0.34 0.239 TA 110 0-140sec KM 220215 RUN#1 LOG(Abs) 0.2 0 -0.2 -0.4 log(absorbance @624.4 nm) 0 30 20 40 2260 280 300 320 340 360 -0.6 -0.8 v-0,0434x + 5 R 0.9976 -1 20 40 60 80 100 120 140 160 180 200 220 240 260 280 300 320 340 360 380 400 420 440 460 D E F G H 1 1 j M RUN RUNA2 LOG(Abs) 04 2 02 A B logAbsorbance 624.4 mm Time (sec) 2 0.221414238 20 3 0.20871002 40 4 0.188928484 60 5 0.169380495 80 6 0.14176323 100 0.115277591 120 B 0.08849047 140 9 0.060320029 160 10 0.028972705 180 11 -0.004364805 200 12 0.039053804 220 13 0.074587909 240 14 -0.110698297 260 15 0149353765 280 16 -0.189767482 300 17 0.231361899 320 18 0273272791 340 19 -0.316052860 360 20 380 21 -1.401209493 400 22 0.443697499 4201 23 -0.488116639 400 24 -0.530177964 460 Shen 03 lopbane 06244 04 CODA GROSZSRSED NO 0 100 110 160 161 100 220 240 0.250 300 120 100 4000 4000 540 Timec RUN#3 LOG(Abs) 0.4 0.2 0 31 32 33 log Absorbance Time (sec) 34 @624.4 nm 35 0.197831693 20 36 0.135132651 40 37 0,062581984 60 38 -0.027334408 80 39 -0.121478204 100 40 -0.231361899 120 41 -0.343901798 140 42 -0.458420756 160 -0.57024772 180 4 -0.684029655 200 -0.798602876 220 46 0910094889 240 47 1.017728767 260 32 logAbsorbance @624.4 nm -0.4 -0.6 -08 01007 -9954 -12 20 10 60 BO 100 140 180 200 220 240 260 120 160 Time (sec) 49 50 51 52 RUN#4 LOG(Abs) 04 0.2 0 -0.2 1 2 logAbsorbance Time (sec) 3 @624.4 nm 54 0.198106999 20 55 0.073351702 40 56 -0.083546051 60 S7 -0.26520017 80 58 -0.450996738 100 59 -0.621602099 120 60 -0.777283529 140 61 62 63 64 65 66 67 68 69 70 log Absorbance 624.4 nm 0.4 0.6 -0.8 Y-0.1673 09975 -1 20 40 60 100 120 140 80 Time (sec) Run 1 here, do 11 >>. from the Absorbance Table (belo) e plots show the equation 5 2-8) using a spreadsheet. to be Tinear in Run 1. plot the 29 8. Calculate the rate constants for each Run using the spreadsheet show the set up for Run 1 here and record the values in Table C. Table C. Sunary of the Rate Constants. Run 5 MA 7 VIRT 1 3 NIA 2 6 8 VIN ng only the function that you determined to be linear in Run 1. plot the a from each of the remaining reactions (Runs 2-8) using a spreadsheet. cain a 'best fit" line for each Run. On each of the plots show the equation this best fit line. For each Run calculate the [dye), from the Absorbance the y-intercept. Show the set up for the calculation in Run 1 here, do all alculations on the spreadsheet, and list all of your results in Table B (below). C = 11.50ml 1.31. 101 2 (610). 1.000 E. Calculate [bleach), for each Run using the spreadsheet and list your results in Table B. As before show the set up for Run 1 here.) HIVI = M V2 2 wycle : Abi 5. Calculate the initial rate for each of Runs 1-8 by using the calculated Absorbance at t = 0 and 5 seconds. Show the set up here for Run 1, but do all calculations with the spreadsheet, and 11st all of your results in Table B. textbook graph 2 Table 8. Summary : Initial Concentrations of Dye and Bleach and initial Rate Run Initial Rate Ihleach (0.019 ] 1 2 3 [1.4.10 [1.9.16 ] [21 no ] (23.10 NA NA 4 5 NA 6 NIA 2 NIA NA NA NA NA ARA B NIA 1. Use the data in Table B to calculate the orders of the reaction. Rate & Obleach] Lage 3 005 0.03792257 LO SE SETTO w OF Time) DO OBREDOK OOO SE BO ONE on otot 5 8 09.00 BARLETTO EGOCIOYO SESSED . 031 ro ODE 16 GENERICO (t 90 260 -0.14935315 015032 OOTA7909 IS CL NE ORE OOC OST EL SOLE000 SOCLORO LGSELTSITO 2 00 SOTOSEGATO 160 0.060320029 0.08849047 120 100 0.14176121 B0 0.13454 0.20671002 20 0.221414738 0624 Timesed lop Absorbance 5 () RUNU LOG(Abs) 4 09 OT RUNENUNES P 0 O N M 1 1 H H G D C. 30 31 32 RUN#3 LOG(Abs) 04 22 -02 log Absorbance 34 624.4 Time sech 35 0.197831593 20 36 0.135132651 40 1 0:052581984 60 35 -0.027334408 80 39 0.121476204 100 0.231361893 220 -0.343901798 140 42 -0.456420756 160 057024772 QE84029655 200 45 09860276 220 100SS 240 1.017720 fogsorbance 64 nm -04 v0.1047 . 13 20 40 SO 80 109 160 180 200 220 20 250 120 140 Time (sec 51 bort RUN#4 LOG(Abs) 51 52 RUN#4 LOG(Abs) 53 54 04 0.2 56 logAbsorbance Time (sec) 624.4 nm 0.198106999 20 0.073351702 40 -0.083546051 60 -0.26520017 80 -0.450996738 100 -0.621602099 120 -0.777283529 140 0 58 -02 log Absorbance 6244 am -0.4 -0,6 52 -08 V.0.1673x R 0.9976 BERG 8 8 8 8 8 8 8 SREB 20 40 10 64 65 80 100 120 140 Time (sec) + 68 69 70 Chart type: Line, 'logAbsorbance @624.4 nm Y-AXIS' by 'Time (sec) X-AXIS Description automatically generated. Chart 72 73 Kinetics-Reaction Rates to Mechanisms INTENT To introduce you to the fundamental methods by which one stud reaction. To show how varying the concentrations of the specie tion, one at a time, can allow you to begin to speculate ont reaction occurs. Con in [A] - In [A]. = - kt earranges to in [A] = - kt + ln [A). erting to base 10 logs 10g [A] = ak k 2.303 t + log [A]. =), is the concentration at time = 0. Plotting in [A] vs time giv intercept of "in [A]," and a slope of "-K". (What would a plot o give for the intercept and the slone?) 27 HOMEWORK QUESTIONS and PROBLEMS you have used as spreadsheet to obtain three fullsized plots of your data from al-plotting Absorbance (on the y axis) vs time (on the x axis), log of the sorbance vs time, and reciprocal of the Absorbance vs time. One of these plots should be linear. utch plot is linear? imobile ob sabonis Vs time. b) Therefore, this is a dat order reaction in dye; and the slope (in general) is equal to what value that is related to the rate law -0.0453"? c) Using the plot which is linear obtain a 'best fit" line with the spreadsheet. From the equation of that line record the slope. Show the calculation of Abs. from the y intercept, then the calculation. If one is necessary, of dye). using e (p. 158). 1.1 1.650 EXO Logo slope - 100CM Abs, I. 315am C: A. 15193350 Dis05: Local [dye). - [1.4.2008 8. 1. 10, LI. S4 Mi y= 0.0.1 legins 2. Prove that the conditions in Runt provided a large excess of bleuch relative to dye. That is using your calculated (dye), above. compare it with bleach). calculated from your answer to Preliminary Question 2 and the amount that the bleach was diluted (see Table A). MV.M.VE () (lMelodveh [ch] Ilmu Hy's St. 0.01 -0.0215M, comprar o TO.CHOE) buach duty kon 3. Using the plot of Absorbance vs time and Abs.. read the time for the first half-11e of the reaction off of the graph. Then read the time for the second and the third half-15ves. 1st half.11fe If this reaction is first order for pseudo first order) in dye you should have obtained 2nd half-life half-lives that are agreely constant. 3rd half-life 4.SOS Does your determination of the half-lives confirm that the reaction is first orders in dye. yes or no? - ng only the function that you determined to be linear in Run 1. plot the a from each of the remaining reactions (Runs 2-8) using a spreadsheet. cain a 'best fit" line for each Run. On each of the plots show the equation this best fit line. For each Run calculate the [dye), from the Absorbance the y-intercept. Show the set up for the calculation in Run 1 here, do all alculations on the spreadsheet, and list all of your results in Table B (below). C = 11.50ml 1.31. 101 2 (610). 1.000 E. Calculate [bleach), for each Run using the spreadsheet and list your results in Table B. As before show the set up for Run 1 here.) HIVI = M V2 2 wycle : Abi 5. Calculate the initial rate for each of Runs 1-8 by using the calculated Absorbance at t = 0 and 5 seconds. Show the set up here for Run 1, but do all calculations with the spreadsheet, and 11st all of your results in Table B. textbook graph 2 Table 8. Summary : Initial Concentrations of Dye and Bleach and initial Rate Run Initial Rate Ihleach (0.019 ] 1 2 3 [1.4.10 [1.9.16 ] [21 no ] (23.10 NA NA 4 5 NA 6 NIA 2 NIA NA NA NA NA ARA B NIA 1. Use the data in Table B to calculate the orders of the reaction. Rate & Obleach] Lage 3 RUN 1 DATA Third half-life value: 0.157 Lumi ABOUT File Table ADA Hunt A 64 30 09 w 320 340 1.00 1.000 100 200 2 1579 0.0 DEE 120 200 320 0.100 200 300 20 440 0-160sec 180-340sec 300-460sec RUN 2 DATA Third half-life value: 0.208 Hun 2 cum 19 HE 1 ORI 1. 0.100 OT . ON LED 34 ove w D 0-160sec 160-320sec 340-500sec 380-540sec RUN 3 DATA Third half-life value: 0.197 Hin 3 TA LO NE 333 153 10 200 0.202 220 200 0.123 WE 150-200 RUN 4 DATA Third half-life value: 0.197 Run 4 Time (5) Abs 624 0 0.071 20 1.578 40 1.184 50 0.825 0.543 100 0.34 0.239 TA 110 0-140sec KM 220215 RUN#1 LOG(Abs) 0.2 0 -0.2 -0.4 log(absorbance @624.4 nm) 0 30 20 40 2260 280 300 320 340 360 -0.6 -0.8 v-0,0434x + 5 R 0.9976 -1 20 40 60 80 100 120 140 160 180 200 220 240 260 280 300 320 340 360 380 400 420 440 460 D E F G H 1 1 j M RUN RUNA2 LOG(Abs) 04 2 02 A B logAbsorbance 624.4 mm Time (sec) 2 0.221414238 20 3 0.20871002 40 4 0.188928484 60 5 0.169380495 80 6 0.14176323 100 0.115277591 120 B 0.08849047 140 9 0.060320029 160 10 0.028972705 180 11 -0.004364805 200 12 0.039053804 220 13 0.074587909 240 14 -0.110698297 260 15 0149353765 280 16 -0.189767482 300 17 0.231361899 320 18 0273272791 340 19 -0.316052860 360 20 380 21 -1.401209493 400 22 0.443697499 4201 23 -0.488116639 400 24 -0.530177964 460 Shen 03 lopbane 06244 04 CODA GROSZSRSED NO 0 100 110 160 161 100 220 240 0.250 300 120 100 4000 4000 540 Timec RUN#3 LOG(Abs) 0.4 0.2 0 31 32 33 log Absorbance Time (sec) 34 @624.4 nm 35 0.197831693 20 36 0.135132651 40 37 0,062581984 60 38 -0.027334408 80 39 -0.121478204 100 40 -0.231361899 120 41 -0.343901798 140 42 -0.458420756 160 -0.57024772 180 4 -0.684029655 200 -0.798602876 220 46 0910094889 240 47 1.017728767 260 32 logAbsorbance @624.4 nm -0.4 -0.6 -08 01007 -9954 -12 20 10 60 BO 100 140 180 200 220 240 260 120 160 Time (sec) 49 50 51 52 RUN#4 LOG(Abs) 04 0.2 0 -0.2 1 2 logAbsorbance Time (sec) 3 @624.4 nm 54 0.198106999 20 55 0.073351702 40 56 -0.083546051 60 S7 -0.26520017 80 58 -0.450996738 100 59 -0.621602099 120 60 -0.777283529 140 61 62 63 64 65 66 67 68 69 70 log Absorbance 624.4 nm 0.4 0.6 -0.8 Y-0.1673 09975 -1 20 40 60 100 120 140 80 Time (sec) Run 1 here, do 11 >>. from the Absorbance Table (belo) e plots show the equation 5 2-8) using a spreadsheet. to be Tinear in Run 1. plot the 29 8. Calculate the rate constants for each Run using the spreadsheet show the set up for Run 1 here and record the values in Table C. Table C. Sunary of the Rate Constants. Run 5 MA 7 VIRT 1 3 NIA 2 6 8 VIN ng only the function that you determined to be linear in Run 1. plot the a from each of the remaining reactions (Runs 2-8) using a spreadsheet. cain a 'best fit" line for each Run. On each of the plots show the equation this best fit line. For each Run calculate the [dye), from the Absorbance the y-intercept. Show the set up for the calculation in Run 1 here, do all alculations on the spreadsheet, and list all of your results in Table B (below). C = 11.50ml 1.31. 101 2 (610). 1.000 E. Calculate [bleach), for each Run using the spreadsheet and list your results in Table B. As before show the set up for Run 1 here.) HIVI = M V2 2 wycle : Abi 5. Calculate the initial rate for each of Runs 1-8 by using the calculated Absorbance at t = 0 and 5 seconds. Show the set up here for Run 1, but do all calculations with the spreadsheet, and 11st all of your results in Table B. textbook graph 2 Table 8. Summary : Initial Concentrations of Dye and Bleach and initial Rate Run Initial Rate Ihleach (0.019 ] 1 2 3 [1.4.10 [1.9.16 ] [21 no ] (23.10 NA NA 4 5 NA 6 NIA 2 NIA NA NA NA NA ARA B NIA 1. Use the data in Table B to calculate the orders of the reaction. Rate & Obleach] Lage 3
Step by Step Solution
There are 3 Steps involved in it

Get step-by-step solutions from verified subject matter experts


