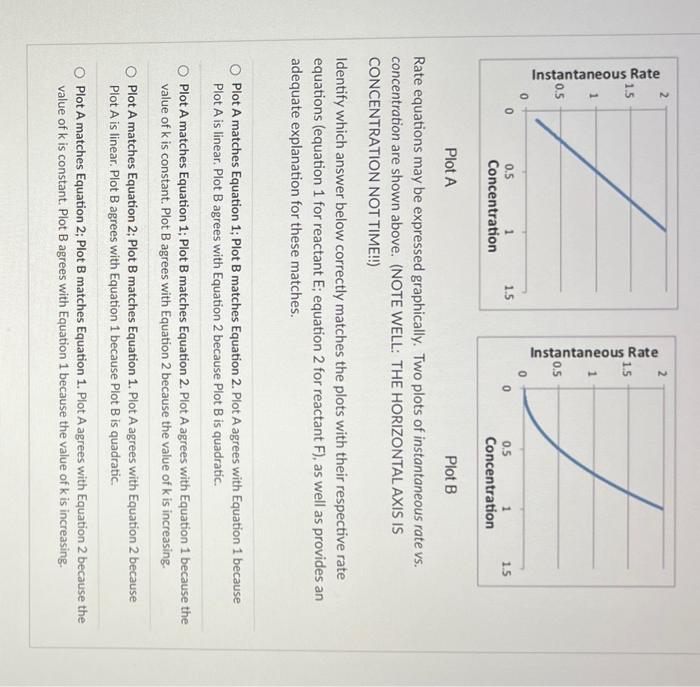
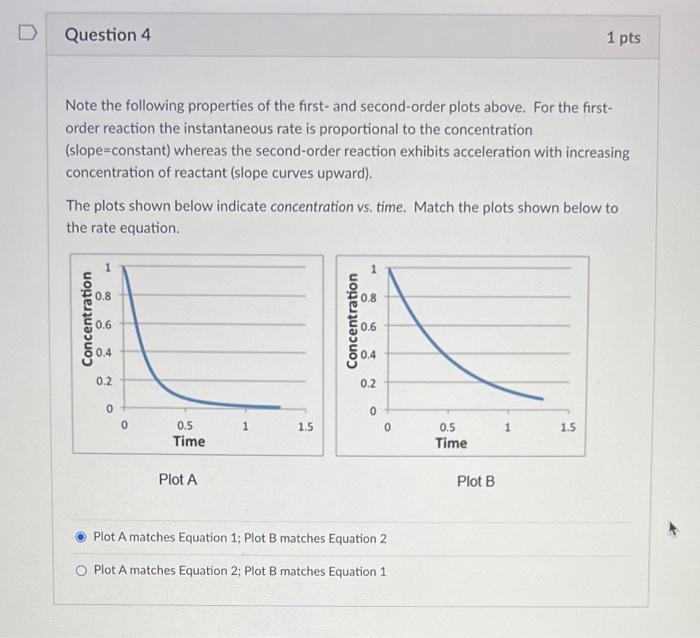
Plot A Plot B Rate equations may be expressed graphically. Two plots of instantaneous rate vs. concentration are shown above. (NOTE WELL: THE HORIZONTAL AXIS IS CONCENTRATION NOT TIME!!!) Identify which answer below correctly matches the plots with their respective rate equations (equation 1 for reactant E; equation 2 for reactant F ), as well as provides an adequate explanation for these matches. Plot A matches Equation 1; Plot B matches Equation 2. Plot A agrees with Equation 1 because Plot A is linear. Plot B agrees with Equation 2 because Plot B is quadratic. Plot A matches Equation 1; Plot B matches Equation 2. Plot A agrees with Equation 1 because the value of k is constant. Plot B agrees with Equation 2 because the value of k is increasing. Plot A matches Equation 2; Plot B matches Equation 1. Plot A agrees with Equation 2 because Plot A is linear. Plot B agrees with Equation 1 because Plot B is quadratic. Plot A matches Equation 2; Plot B matches Equation 1. Plot A agrees with Equation 2 because the value of k is constant. Plot B agrees with Equation 1 because the value of k is increasing. Note the following properties of the first- and second-order plots above. For the firstorder reaction the instantaneous rate is proportional to the concentration (slope=constant) whereas the second-order reaction exhibits acceleration with increasing concentration of reactant (slope curves upward). The plots shown below indicate concentration vs. time. Match the plots shown below to the rate equation. Plot A Plot B Plot A matches Equation 1; Plot B matches Equation 2 Plot A matches Equation 2; Plot B matches Equation 1 Rate Equation 1: rate =k1[E]1;k1=2.0s1 Rate Equation 2: rate =k2[F]2;k2=2.0M1s1 Plot A Plot B Rate equations may be expressed graphically. Two plots of instantaneous rate vs. concentration are shown above. (NOTE WELL: THE HORIZONTAL AXIS IS CONCENTRATION NOT TIME!!!) Identify which answer below correctly matches the plots with their respective rate equations (equation 1 for reactant E; equation 2 for reactant F ), as well as provides an adequate explanation for these matches. Plot A matches Equation 1; Plot B matches Equation 2. Plot A agrees with Equation 1 because Plot A is linear. Plot B agrees with Equation 2 because Plot B is quadratic. Plot A matches Equation 1; Plot B matches Equation 2. Plot A agrees with Equation 1 because the value of k is constant. Plot B agrees with Equation 2 because the value of k is increasing. Plot A matches Equation 2; Plot B matches Equation 1. Plot A agrees with Equation 2 because Plot A is linear. Plot B agrees with Equation 1 because Plot B is quadratic. Plot A matches Equation 2; Plot B matches Equation 1. Plot A agrees with Equation 2 because the value of k is constant. Plot B agrees with Equation 1 because the value of k is increasing. Note the following properties of the first- and second-order plots above. For the firstorder reaction the instantaneous rate is proportional to the concentration (slope=constant) whereas the second-order reaction exhibits acceleration with increasing concentration of reactant (slope curves upward). The plots shown below indicate concentration vs. time. Match the plots shown below to the rate equation. Plot A Plot B Plot A matches Equation 1; Plot B matches Equation 2 Plot A matches Equation 2; Plot B matches Equation 1 Rate Equation 1: rate =k1[E]1;k1=2.0s1 Rate Equation 2: rate =k2[F]2;k2=2.0M1s1