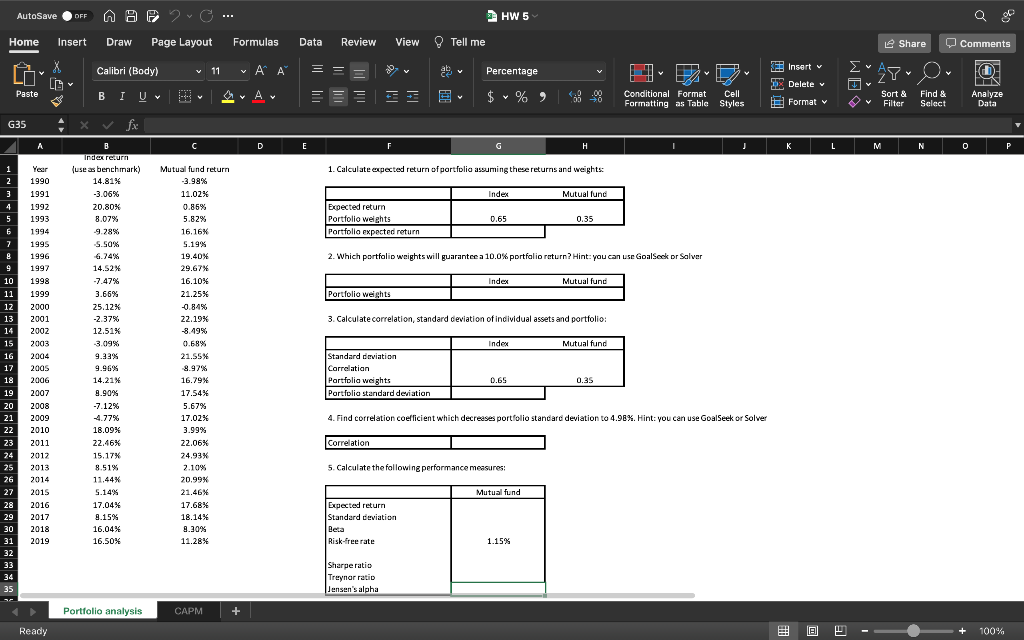
AutoSave OFF AOF ... HW 5 Q Home Insert Draw Page Layout Formulas Data Review View Tell me Le Share Comments Calibri (Body) v v 11 = Insert v v Ov Percentage Ayu O LC DX Delete v @ NN Analyze Data Paste BI U A = $ %, Y Conditional Format Cell Formatting as Table Styles Format v Sort & Filter Find & Select G35 x fx A C D E F G . I J K L M N 0 P 1. Calculate expected return of portfolia assuming these returns and weights: Index Mutual fund Expected return Portfolio weights Portfolia expected return 0.65 0.35 2. Which portfolio weights will guarantee a 10.0% portfolio return? Hint: you can use Goalscok or Salver Index Mutual fund Portfolio weights Year 1990 1991 1992 1993 1994 1995 1996 1997 1998 1999 2000 2001 2002 2003 2004 2005 2006 2007 2008 2009 2010 2011 2012 2013 2014 3. Calculate correlation, standard deviation of individual assets and portfolio: B Index return {use as benchmark) 14.81% -3.06% 20.80% 8.07% -9.28% 5.50% 6.74% 14.52% -7.47% 3.66% 25.12% -2.37% 12.51% 3.09% 9.33% 9.96% 14.21% 9.90% -7.12% 4.77% 18.09% 22.46% 15.17 8.51% 11,44% 5.14% 17.04% 9.15% 16.04% 16.50% Mutual fund return -3.98% 11.02% 0.85% 5.82% 16.16% 5.19% 19.40% 29.67% 16.10% 21.25% -0.84% 22.19% -8.49% 0.68% 21.55% 8.97% 16.79% 17.54% 5.67% 17.02% 3.99% 22.06% 24.93% 2.10% 20.99% 21.46% 17.68% Index 2 3 4 5 6 7 8 9 10 11 12 13 14 15 16 17 18 19 20 21 22 23 24 25 26 27 28 29 30 31 32 33 34 35 Mutual fund Standard deviation Correlatian Portfolia weights Portfolia standard deviation 0.65 0.35 4. Find correlation coefficient which decreases portfolio standard deviation to 4.98%. Hint: you can use Goal Seek or Solver Correlation 5. Calculate the following performance measures: Mutual fund 2015 2016 2017 2018 2019 18.14% 9.30% 11.28% % Expected return Standard deviation Beta Risk-free rate 1.15% Sharpe ratio Treynar ratio Jensen's alpha Portfolio analysis CAPM + Ready 1B 100% AutoSave OFF AOF ... HW 5 Q Home Insert Draw Page Layout Formulas Data Review View Tell me Le Share Comments Calibri (Body) v v 11 = Insert v v Ov Percentage Ayu O LC DX Delete v @ NN Analyze Data Paste BI U A = $ %, Y Conditional Format Cell Formatting as Table Styles Format v Sort & Filter Find & Select G35 x fx A C D E F G . I J K L M N 0 P 1. Calculate expected return of portfolia assuming these returns and weights: Index Mutual fund Expected return Portfolio weights Portfolia expected return 0.65 0.35 2. Which portfolio weights will guarantee a 10.0% portfolio return? Hint: you can use Goalscok or Salver Index Mutual fund Portfolio weights Year 1990 1991 1992 1993 1994 1995 1996 1997 1998 1999 2000 2001 2002 2003 2004 2005 2006 2007 2008 2009 2010 2011 2012 2013 2014 3. Calculate correlation, standard deviation of individual assets and portfolio: B Index return {use as benchmark) 14.81% -3.06% 20.80% 8.07% -9.28% 5.50% 6.74% 14.52% -7.47% 3.66% 25.12% -2.37% 12.51% 3.09% 9.33% 9.96% 14.21% 9.90% -7.12% 4.77% 18.09% 22.46% 15.17 8.51% 11,44% 5.14% 17.04% 9.15% 16.04% 16.50% Mutual fund return -3.98% 11.02% 0.85% 5.82% 16.16% 5.19% 19.40% 29.67% 16.10% 21.25% -0.84% 22.19% -8.49% 0.68% 21.55% 8.97% 16.79% 17.54% 5.67% 17.02% 3.99% 22.06% 24.93% 2.10% 20.99% 21.46% 17.68% Index 2 3 4 5 6 7 8 9 10 11 12 13 14 15 16 17 18 19 20 21 22 23 24 25 26 27 28 29 30 31 32 33 34 35 Mutual fund Standard deviation Correlatian Portfolia weights Portfolia standard deviation 0.65 0.35 4. Find correlation coefficient which decreases portfolio standard deviation to 4.98%. Hint: you can use Goal Seek or Solver Correlation 5. Calculate the following performance measures: Mutual fund 2015 2016 2017 2018 2019 18.14% 9.30% 11.28% % Expected return Standard deviation Beta Risk-free rate 1.15% Sharpe ratio Treynar ratio Jensen's alpha Portfolio analysis CAPM + Ready 1B 100%