Answered step by step
Verified Expert Solution
Question
1 Approved Answer
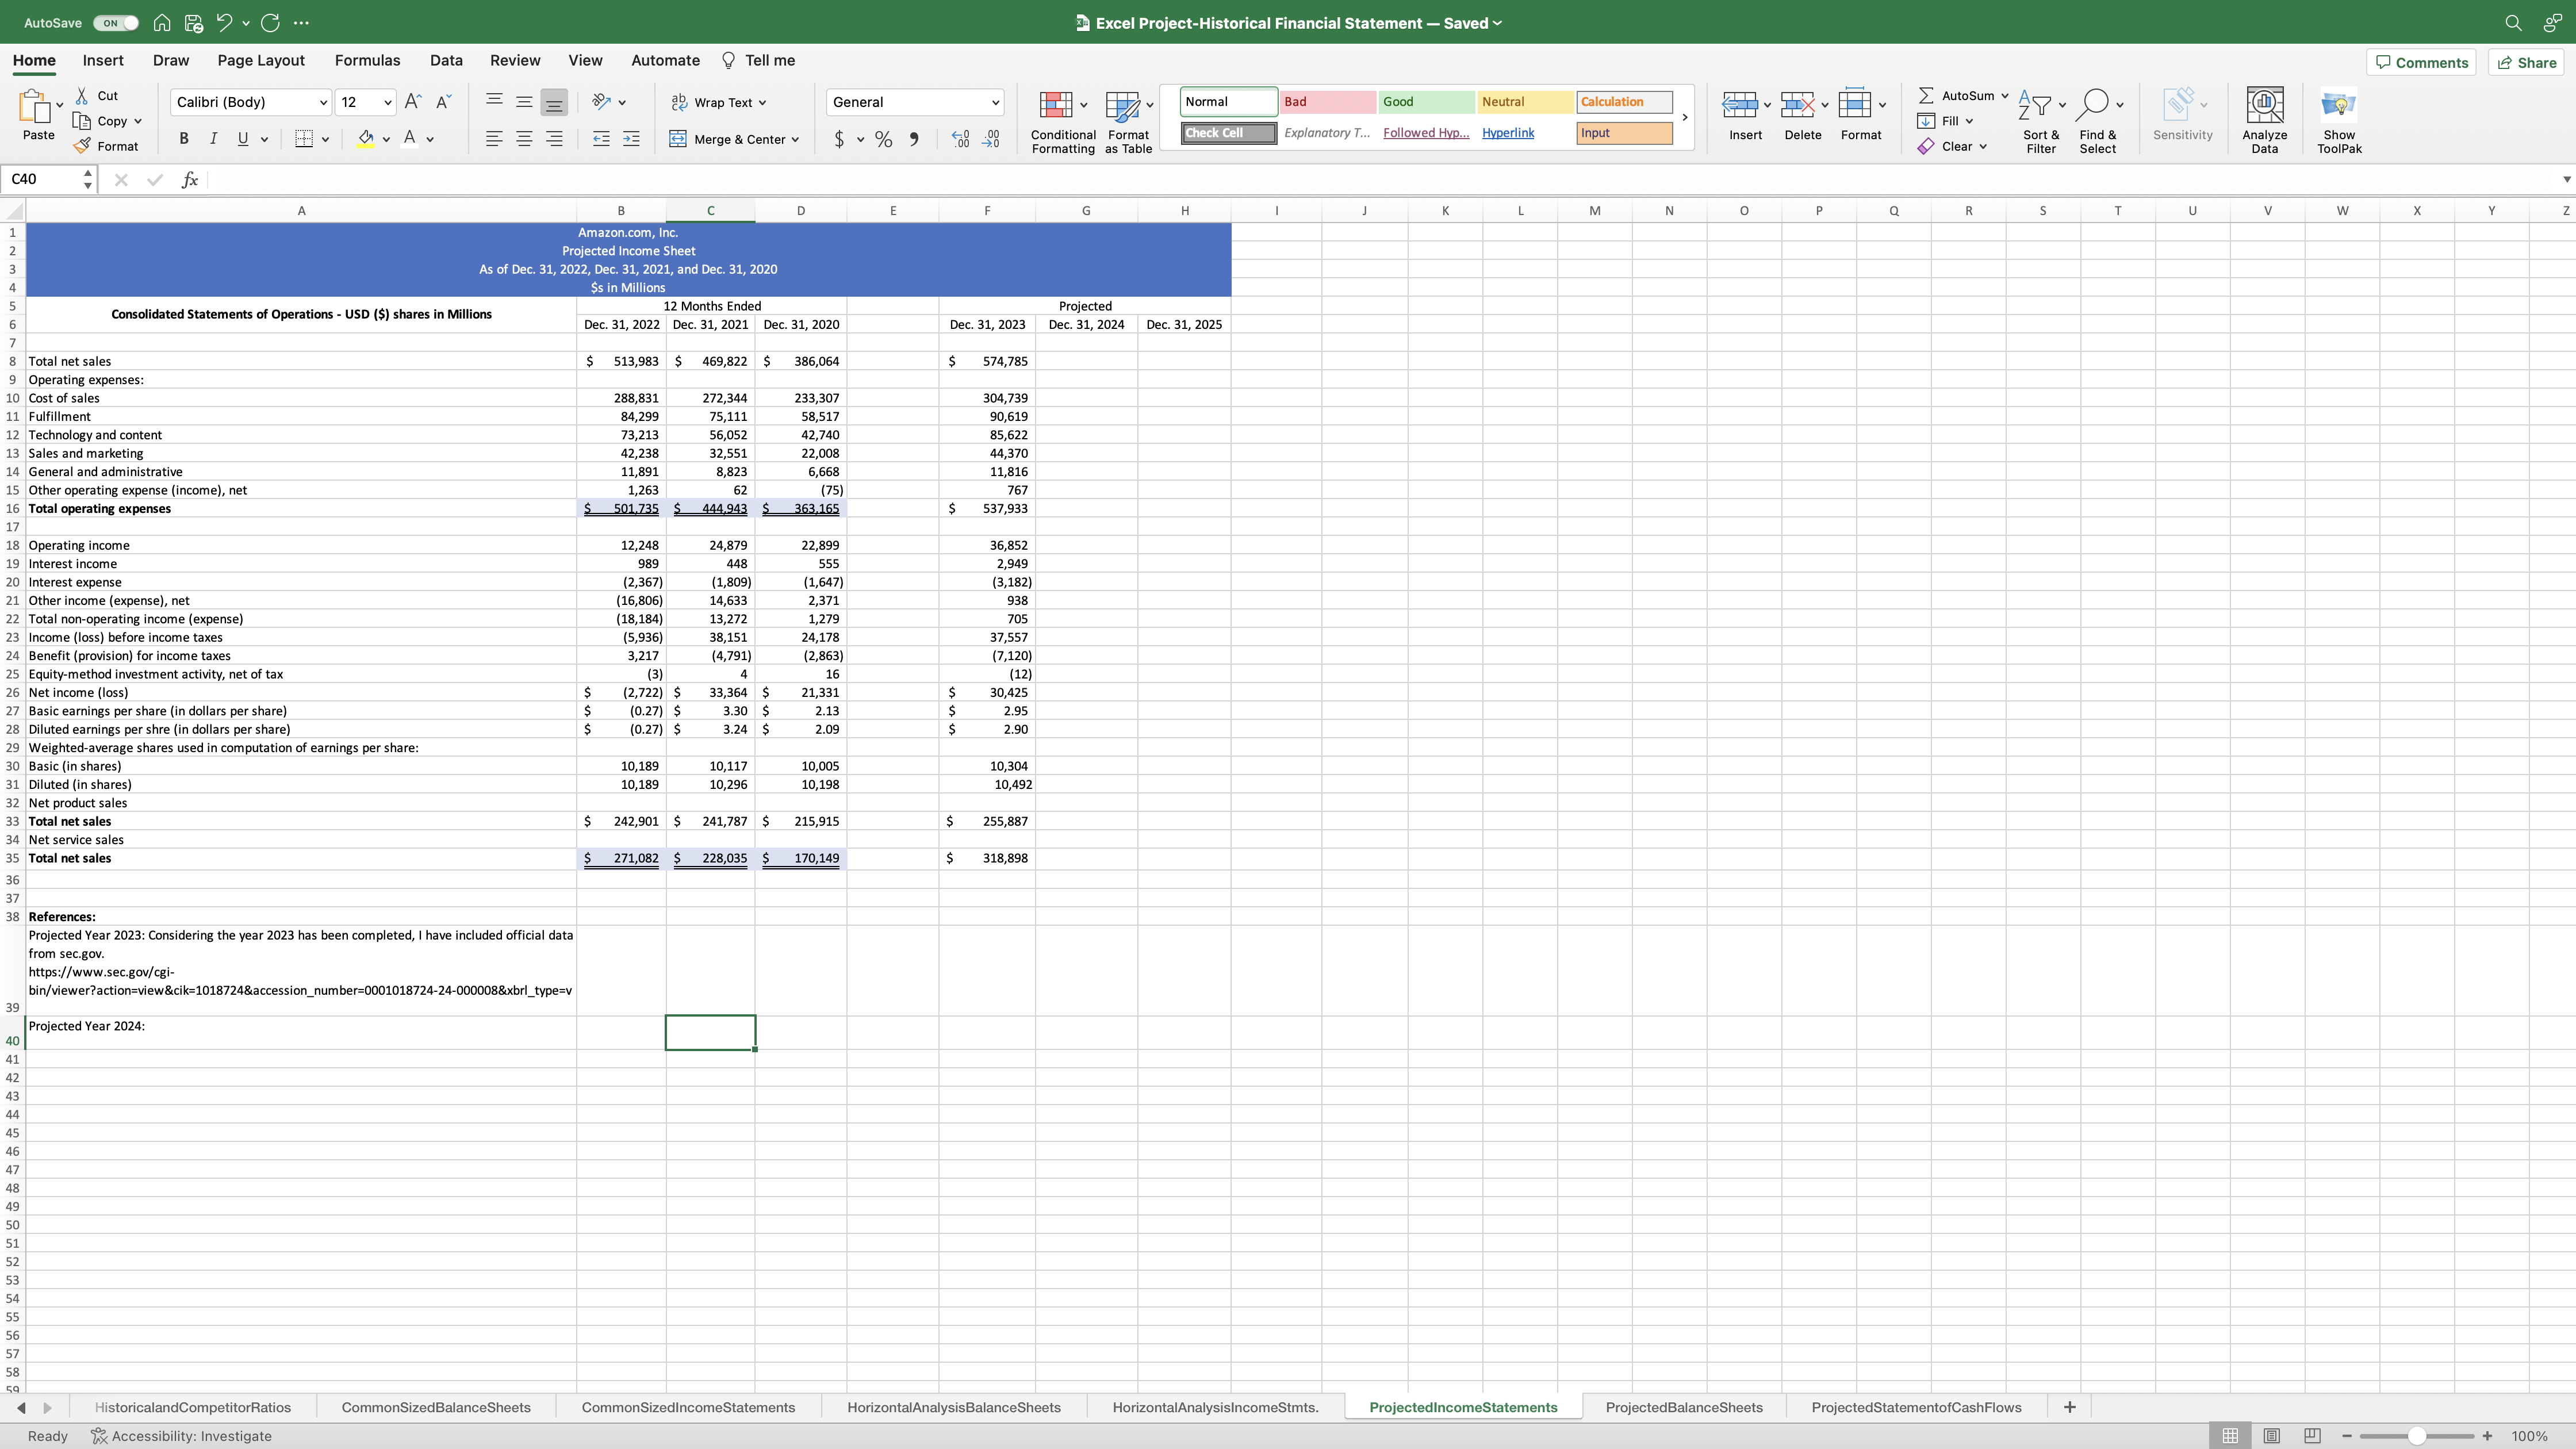
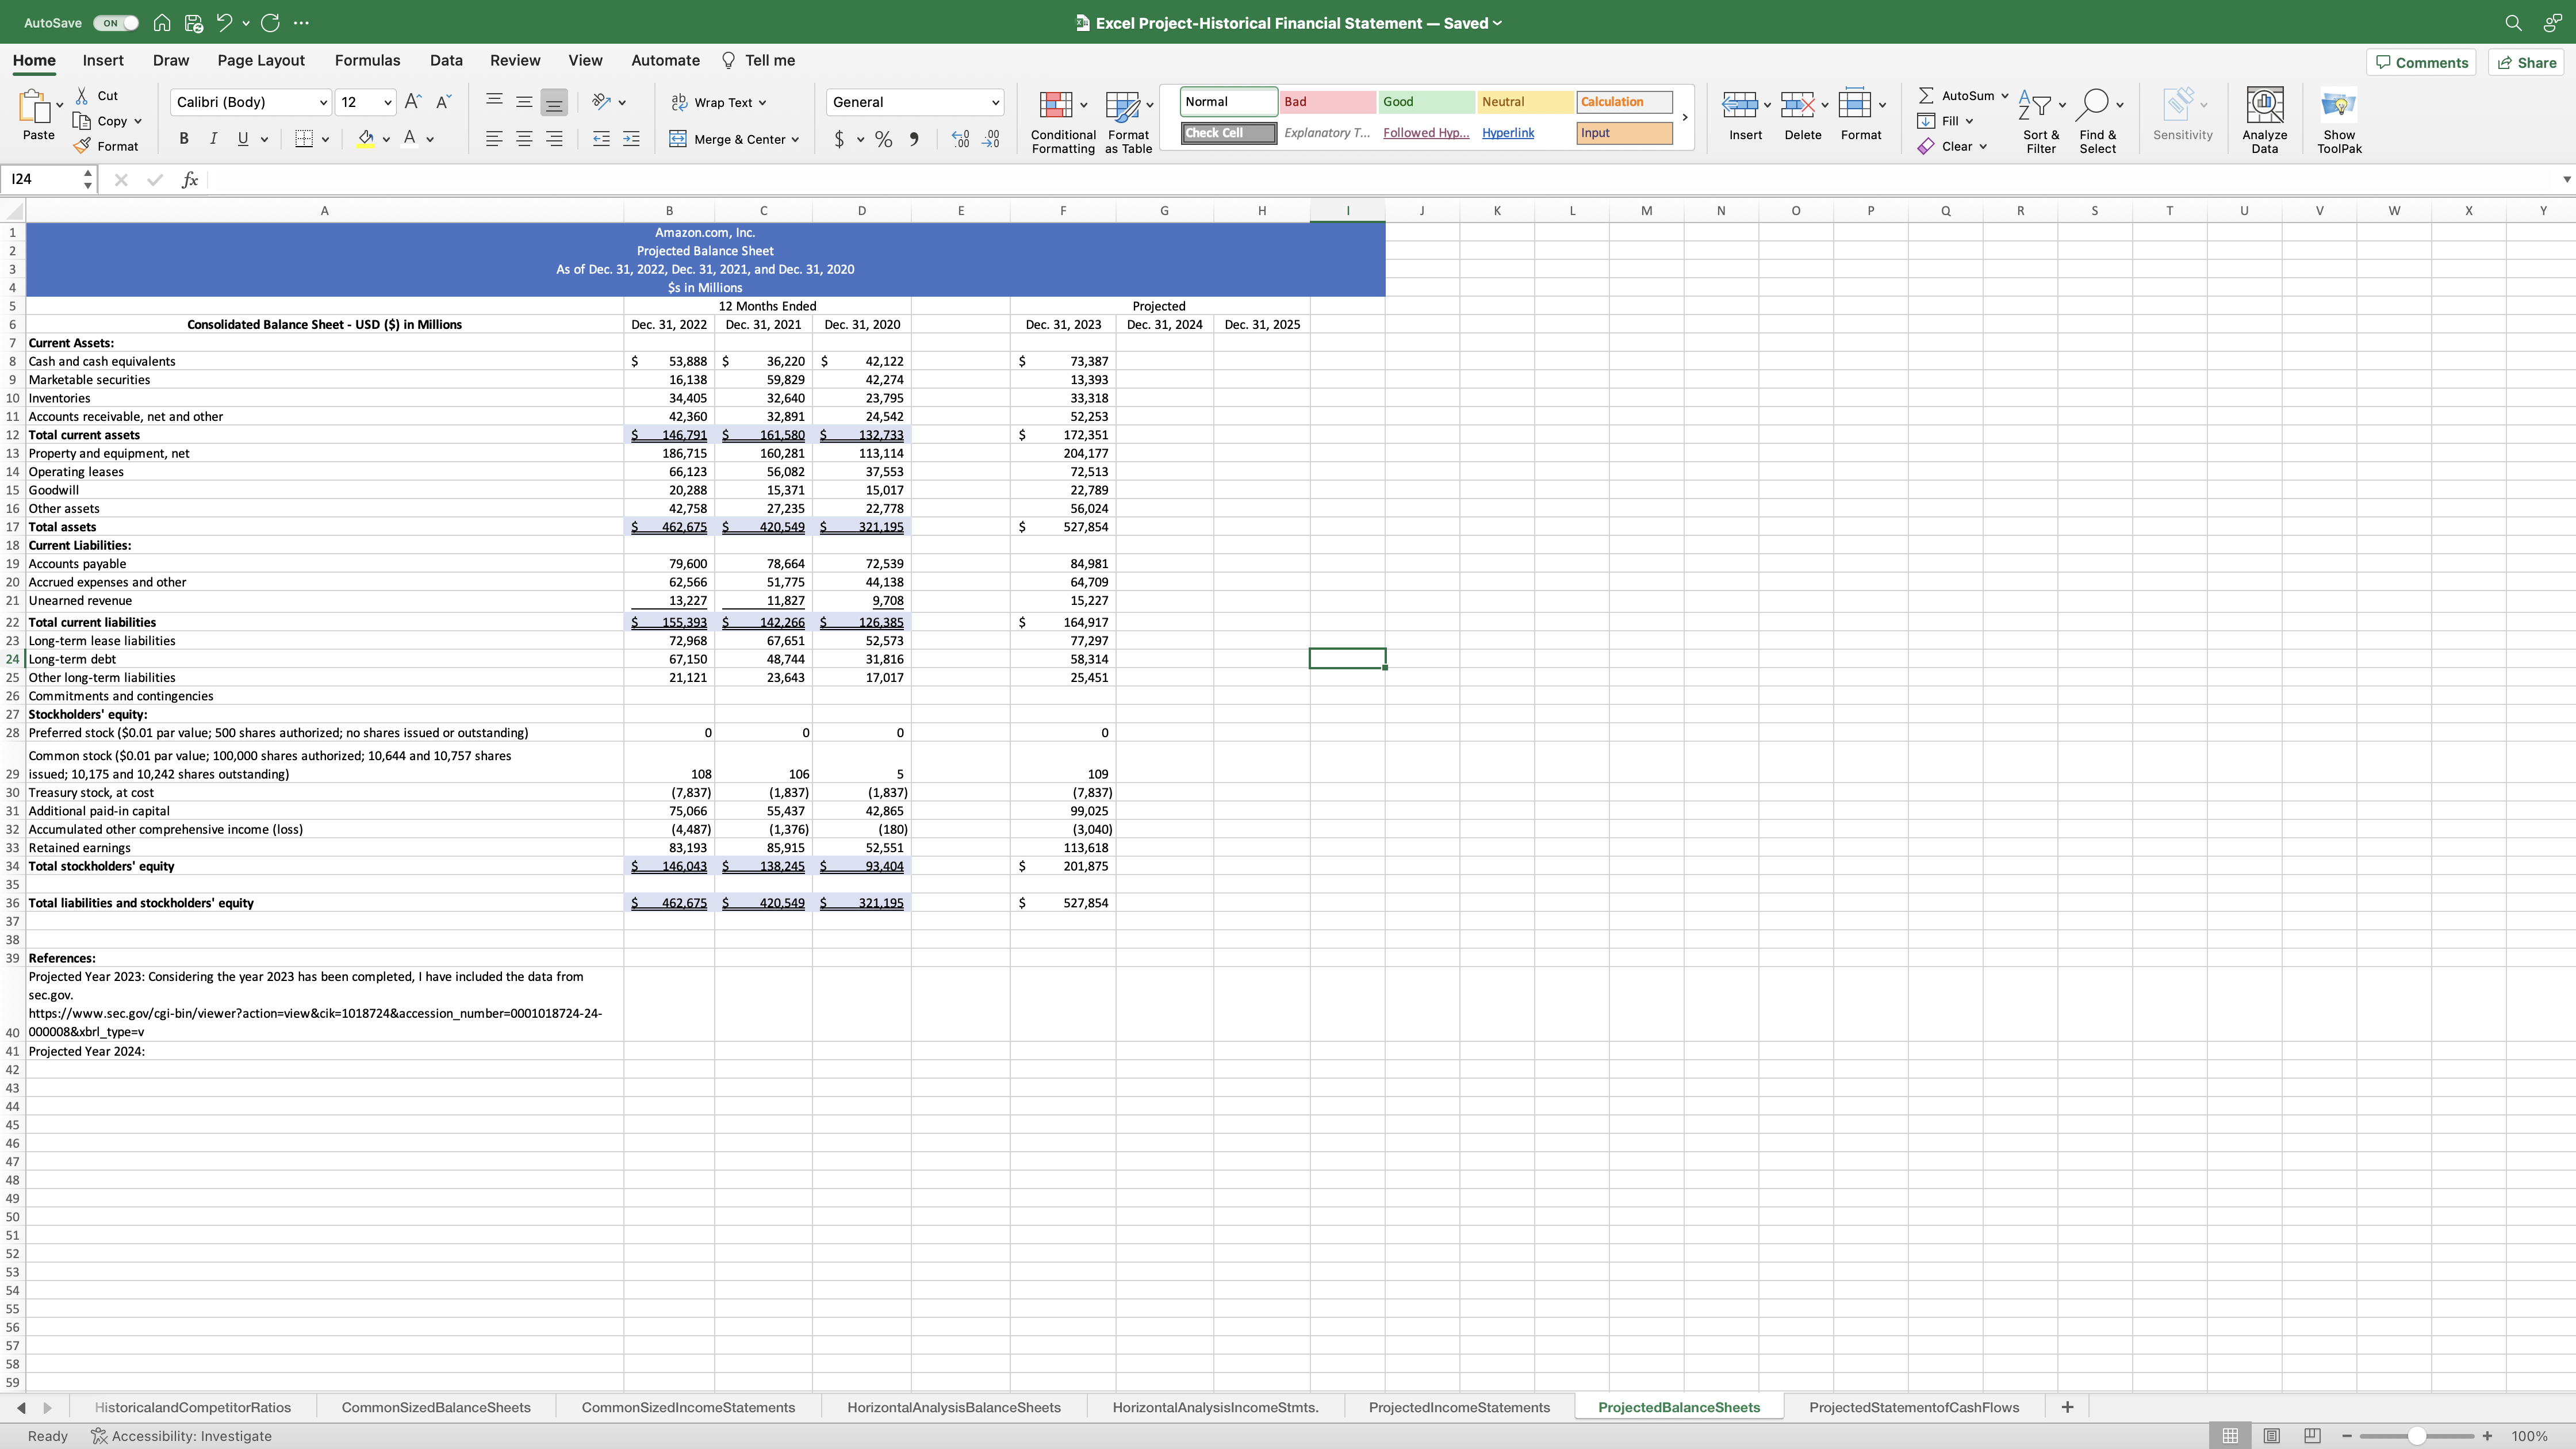
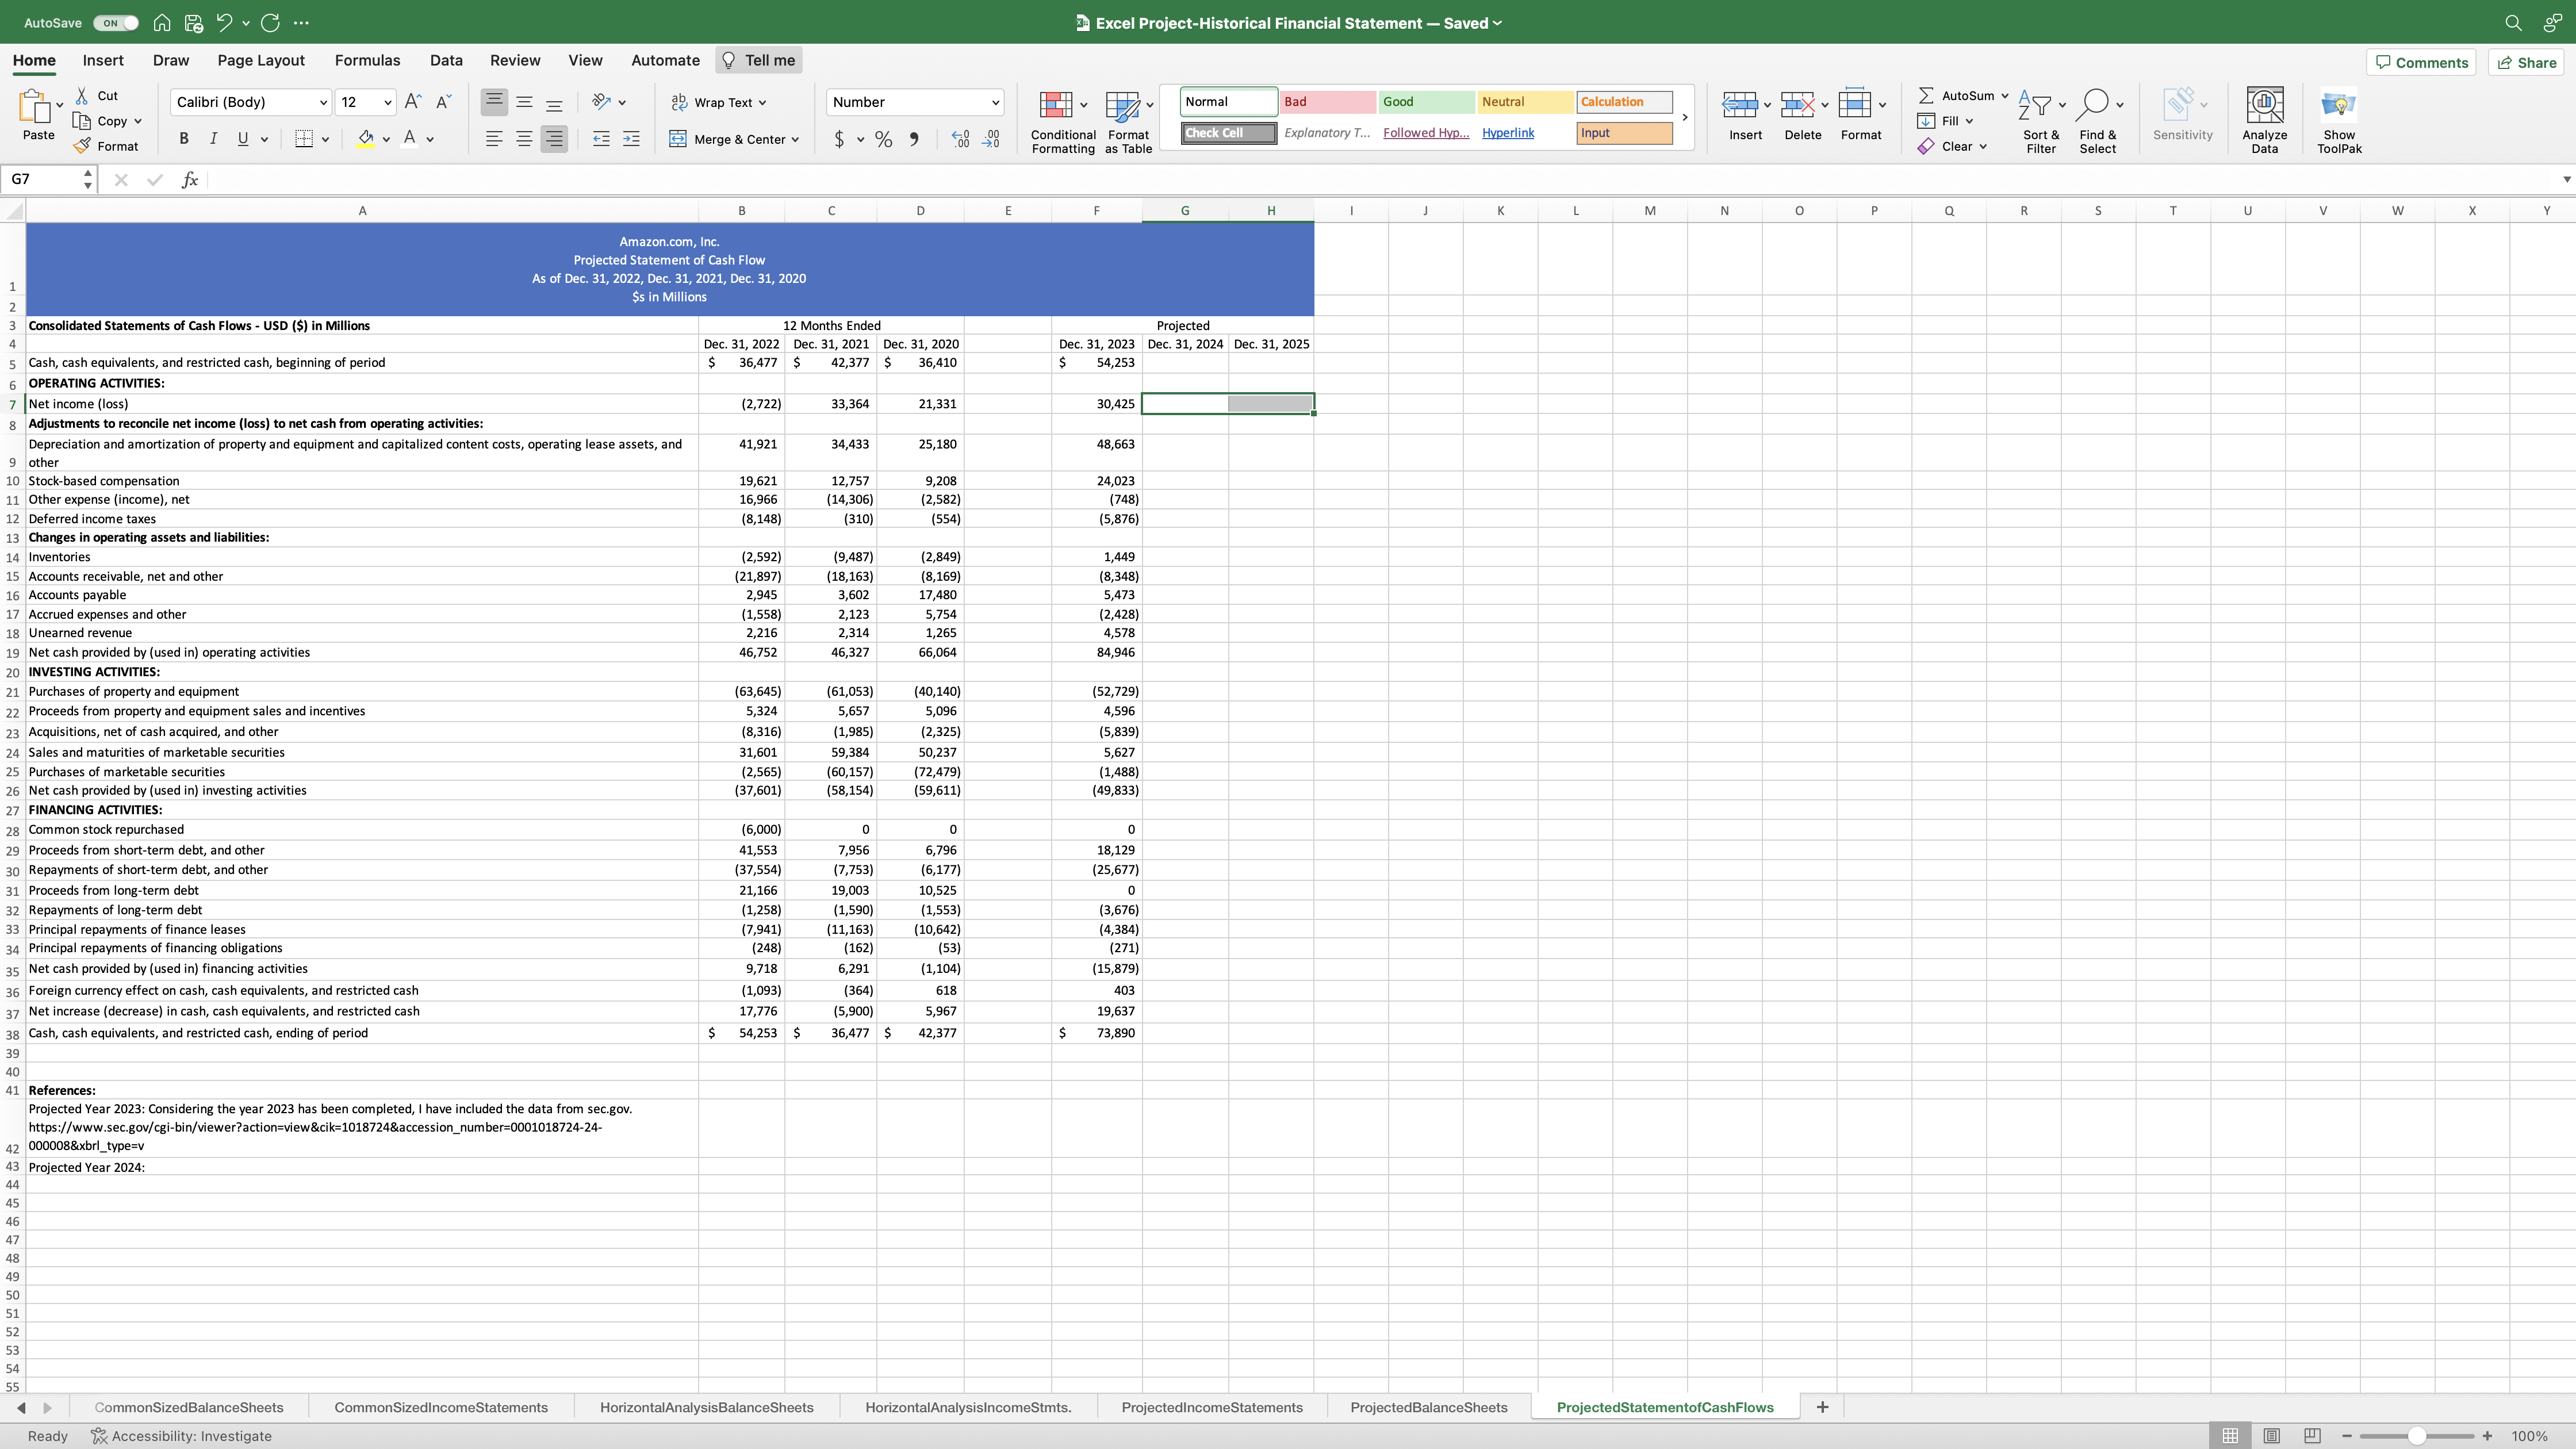
AutoSave ON Excel Project-Historical Financial Statement - Saved Autosum T Insert Delete Format Fill Clear Find & Sort & Filter Select Sensitivity Analyze Data


AutoSave ON Excel Project-Historical Financial Statement - Saved Autosum T Insert Delete Format Fill Clear Find & Sort & Filter Select Sensitivity Analyze Data Show ToolPak J K L M N O P Q R Wrap Text Normal Bad Good Neutral Calculation Merge & Center $ % 0 .00 Conditional 0 Format Formatting as Table Check Cell Explanatory T... Followed Hyp... Hyperlink Input Draw Page Layout Formulas Data Review View Automate Calibri (Body) 12 A A Copy v B I U A Format fx Home Insert Cut Paste C40 Tell me General A 1 2 3 4 5 6 7 8 Total net sales 9 Operating expenses: B C D E F G H Amazon.com, Inc. Consolidated Statements of Operations - USD ($) shares in Millions Projected Income Sheet As of Dec. 31, 2022, Dec. 31, 2021, and Dec. 31, 2020 $s in Millions 12 Months Ended Dec. 31, 2022 Dec. 31, 2021 Dec. 31, 2020 Dec. 31, 2023 Projected Dec. 31, 2024 Dec. 31, 2025 $ 513,983 $ 469,822 $ 386,064 $ 574,785 17 10 Cost of sales 11 Fulfillment 12 Technology and content 13 Sales and marketing 14 General and administrative 15 Other operating expense (income), net 16 Total operating expenses 18 Operating income 19 Interest income 20 Interest expense 21 Other income (expense), net 22 Total non-operating income (expense) 23 Income (loss) before income taxes 24 Benefit (provision) for income taxes 25 Equity-method investment activity, net of tax 26 Net income (loss) 27 Basic earnings per share (in dollars per share) 28 Diluted earnings per shre (in dollars per share) 288,831 272,344 233,307 304,739 84,299 75,111 58,517 90,619 73,213 56,052 42,740 85,622 42,238 32,551 22,008 44,370 11,891 8,823 6,668 11,816 1,263 62 (75) 767 $ 501,735 $ 444.943 363,165 $ 537,933 12,248 24,879 22,899 36,852 989 448 555 2,949 (2,367) (1,809) (1,647) (3,182) (16,806) 14,633 2,371 938 (18,184) 13,272 1,279 705 (5,936) 38,151 24,178 37,557 3,217 (4,791) (2,863) (7,120) (3) 4 16 (12) $ (2,722) $ 33,364 $ 21,331 $ (0.27) $ 3.30 $ 2.13 $ (0.27) $ 3.24 $ 2.09 sssss $ 30,425 $ 2.95 $ 2.90 29 Weighted-average shares used in computation of earnings per share: 30 Basic (in shares) 10,189 10,117 31 Diluted (in shares) 10,189 10,296 10,005 10,198 10,304 10,492 32 Net product sales 33 Total net sales $ 242,901 $ 241,787 $ 215,915 255,887 34 Net service sales 35 Total net sales $ 271,082 $ 228,035 $ 170,149 $ 318,898 36 37 38 References: Projected Year 2023: Considering the year 2023 has been completed, I have included official data from sec.gov. https://www.sec.gov/cgi- bin/viewer?action=view&cik=1018724&accession_number=0001018724-24-000008&xbrl_type=v 39 Projected Year 2024: 40 41 42 43 50 51 52 53 56 58 59 77744474755NSESSSS 46 48 49 S BD Comments Share T U V W X Y Z HistoricalandCompetitorRatios CommonSized BalanceSheets CommonSized IncomeStatements HorizontalAnalysis Balance Sheets HorizontalAnalysisIncomeStmts. ProjectedIncomeStatements ProjectedBalanceSheets ProjectedStatementofCash Flows Ready Accessibility: Investigate + B + 100% AutoSave ON Home Insert Draw C Page Layout Paste 124 1 2 3 4 5 6 Formulas Data Review View Automate ' A Cut Calibri (Body) 12 Copy B I U Format fx A 7 Current Assets: 8 Cash and cash equivalents 9 Marketable securities 10 Inventories Consolidated Balance Sheet - USD ($) in Millions 11 Accounts receivable, net and other 12 Total current assets 13 Property and equipment, net 14 Operating leases 15 Goodwill 16 Other assets 17 Total assets 18 Current Liabilities: B Tell me Excel Project-Historical Financial Statement Good - Saved Neutral Explanatory T... Followed Hyp... Hyperlink Wrap Text General Normal Bad Merge & Center $ % Conditional .00 0 Format Formatting as Table Check Cell Calculation Input Autosum T Insert Delete Format Fill Clear Sort & Filter Find & Select Sensitivity Analyze Data Show ToolPak BD Comments Share D E F G H | J K L M N O P Q R S T U V W X Y Amazon.com, Inc. Projected Balance Sheet As of Dec. 31, 2022, Dec. 31, 2021, and Dec. 31, 2020 19 Accounts payable 20 Accrued expenses and other 21 Unearned revenue 22 Total current liabilities 23 Long-term lease liabilities 24 Long-term debt 25 Other long-term liabilities 26 Commitments and contingencies 27 Stockholders' equity: 28 Preferred stock ($0.01 par value; 500 shares authorized; no shares issued or outstanding) Common stock ($0.01 par value; 100,000 shares authorized; 10,644 and 10,757 shares 29 issued; 10,175 and 10,242 shares outstanding) 30 Treasury stock, at cost 31 Additional paid-in capital 32 Accumulated other comprehensive income (loss) 33 Retained earnings 34 Total stockholders' equity 35 36 Total liabilities and stockholders' equity 37 38 $s in Millions Dec. 31, 2022 12 Months Ended Dec. 31, 2021 Projected Dec. 31, 2020 Dec. 31, 2023 Dec. 31, 2024 Dec. 31, 2025 $ 53,888 $ 16,138 36,220 $ 59,829 42,122 $ 73,387 42,274 13,393 34,405 32,640 23,795 33,318 42,360 32,891 24,542 52,253 $ 146,791 $ 161.580 132,733 $ 172,351 186,715 160,281 113,114 204,177 66,123 56,082 37,553 72,513 20,288 15,371 15,017 22,789 42,758 27,235 22,778 56,024 $ 462,675 $ 420,549 $ 321.195 $ 527,854 79,600 78,664 72,539 84,981 62,566 51,775 44,138 64,709 13,227 11,827 9,708 15,227 S 155,393 $ 142,266 126,385 $ en 164,917 72,968 67,651 52,573 77,297 67,150 48,744 31,816 58,314 21,121 23,643 17,017 25,451 39 References: Projected Year 2023: Considering the year 2023 has been completed, I have included the data from sec.gov. https://www.sec.gov/cgi-bin/viewer?action=view&cik=1018724&accession_number=0001018724-24- 40 000008&xbrl_type=v 41 Projected Year 2024: 42 43 44 45 46 47 48 49 50 51 52 53 54 55 56 57 58 59 0 0 0 0 108 106 5 109 (7,837) (1,837) (1,837) (7,837) 75,066 55,437 42,865 99,025 (4,487) (1,376) (180) (3,040) 83,193 85,915 52,551 113,618 $ 146,043 138,245 $ 93,404 $ 201,875 $ 462.675 $ 420,549 $ 321,195 $ 527,854 HistoricalandCompetitorRatios CommonSized BalanceSheets CommonSized Income Statements HorizontalAnalysis Balance Sheets HorizontalAnalysisIncomeStmts. ProjectedIncomeStatements ProjectedBalance Sheets Ready Accessibility: Investigate ProjectedStatementofCash Flows + B A + 100% AutoSave ON C Review View Automate Home Insert Draw Page Layout Formulas Data Cut Calibri (Body) 12 ' Copy Paste B I U A == Format G7 fx A Tell me Excel Project-Historical Financial Statement Good - Saved Neutral Explanatory T... Followed Hyp... Hyperlink Wrap Text Number Normal Bad Merge & Center $ % Conditional .00 0 Format Formatting as Table Check Cell Calculation Autosum Input Insert Delete Format Fill Clear Sort & Filter Find & Select T Sensitivity Analyze Data Show ToolPak BD Comments Share B C D E F G H | J K L M N P a R S T U V W X Y Amazon.com, Inc. Projected Statement of Cash Flow As of Dec. 31, 2022, Dec. 31, 2021, Dec. 31, 2020 12 Months Ended Projected $ Dec. 31, 2022 36,477 Dec. 31, 2021 Dec. 31, 2020 $ 42,377 $ Dec. 31, 2023 Dec. 31, 2024 Dec. 31, 2025 36,410 $ 54,253 (2,722) 33,364 21,331 30,425 1234567 Consolidated Statements of Cash Flows - USD ($) in Millions 5 Cash, cash equivalents, and restricted cash, beginning of period 6 OPERATING ACTIVITIES: 7 Net income (loss) 8 Adjustments to reconcile net income (loss) to net cash from operating activities: $s in Millions Depreciation and amortization of property and equipment and capitalized content costs, operating lease assets, and 9 other 41,921 34,433 25,180 48,663 10 Stock-based compensation 19,621 12,757 9,208 24,023 11 Other expense (income), net 12 Deferred income taxes 13 Changes in operating assets and liabilities: 14 Inventories 15 Accounts receivable, net and other 16 Accounts payable 17 Accrued expenses and other 18 Unearned revenue 16,966 (14,306) (2,582) (748) (8,148) (310) (554) (5,876) (2,592) (9,487) (2,849) 1,449 (21,897) (18,163) (8,169) (8,348) 2,945 3,602 17,480 5,473 (1,558) 2,123 5,754 (2,428) 2,216 2,314 1,265 4,578 19 Net cash provided by (used in) operating activities 46,752 46,327 66,064 84,946 20 INVESTING ACTIVITIES: 21 Purchases of property and equipment (63,645) (61,053) (40,140) (52,729) 22 Proceeds from property and equipment sales and incentives 5,324 5,657 5,096 4,596 23 Acquisitions, net of cash acquired, and other (8,316) (1,985) (2,325) (5,839) 24 Sales and maturities of marketable securities 31,601 59,384 50,237 5,627 25 Purchases of marketable securities 26 Net cash provided by (used in) investing activities 27 FINANCING ACTIVITIES: 28 Common stock repurchased 29 Proceeds from short-term debt, and other 30 Repayments of short-term debt, and other 31 Proceeds from long-term debt 32 Repayments of long-term debt 33 Principal repayments of finance leases 34 Principal repayments of financing obligations 35 Net cash provided by (used in) financing activities 36 Foreign currency effect on cash, cash equivalents, and restricted cash 37 Net increase (decrease) in cash, cash equivalents, and restricted cash 38 Cash, cash equivalents, and restricted cash, ending of period (2,565) (60,157) (72,479) (1,488) (37,601) (58,154) (59,611) (49,833) (6,000) 0 0 0 41,553 7,956 6,796 (37,554) (7,753) (6,177) 18,129 (25,677) 21,166 19,003 10,525 0 (1,258) (1,590) (1,553) (3,676) (7,941) (11,163) (10,642) (4,384) (248) (162) (53) (271) 9,718 6,291 (1,104) (15,879) (1,093) 17,776 (364) (5,900) 618 403 5,967 19,637 $ 54,253 $ 36,477 $ 42,377 $ 73,890 39 40 41 References: Projected Year 2023: Considering the year 2023 has been completed, I have included the data from sec.gov. https://www.sec.gov/cgi-bin/viewer?action=view&cik=1018724&accession_number=0001018724-24- 42 000008&xbrl_type=v 43 Projected Year 2024: 44 45 46 47 48 49 50 51 52 53 54 55 CommonSizedBalanceSheets CommonSized Income Statements HorizontalAnalysis Balance Sheets HorizontalAnalysisIncomeStmts. Projected IncomeStatements ProjectedBalanceSheets ProjectedStatementofCash Flows + Ready Accessibility: Investigate B A + 100%
Step by Step Solution
There are 3 Steps involved in it
Step: 1

Get Instant Access to Expert-Tailored Solutions
See step-by-step solutions with expert insights and AI powered tools for academic success
Step: 2

Step: 3

Ace Your Homework with AI
Get the answers you need in no time with our AI-driven, step-by-step assistance
Get Started


