AVIATION MANAGEMENT (AVM3201)
Please answer tables
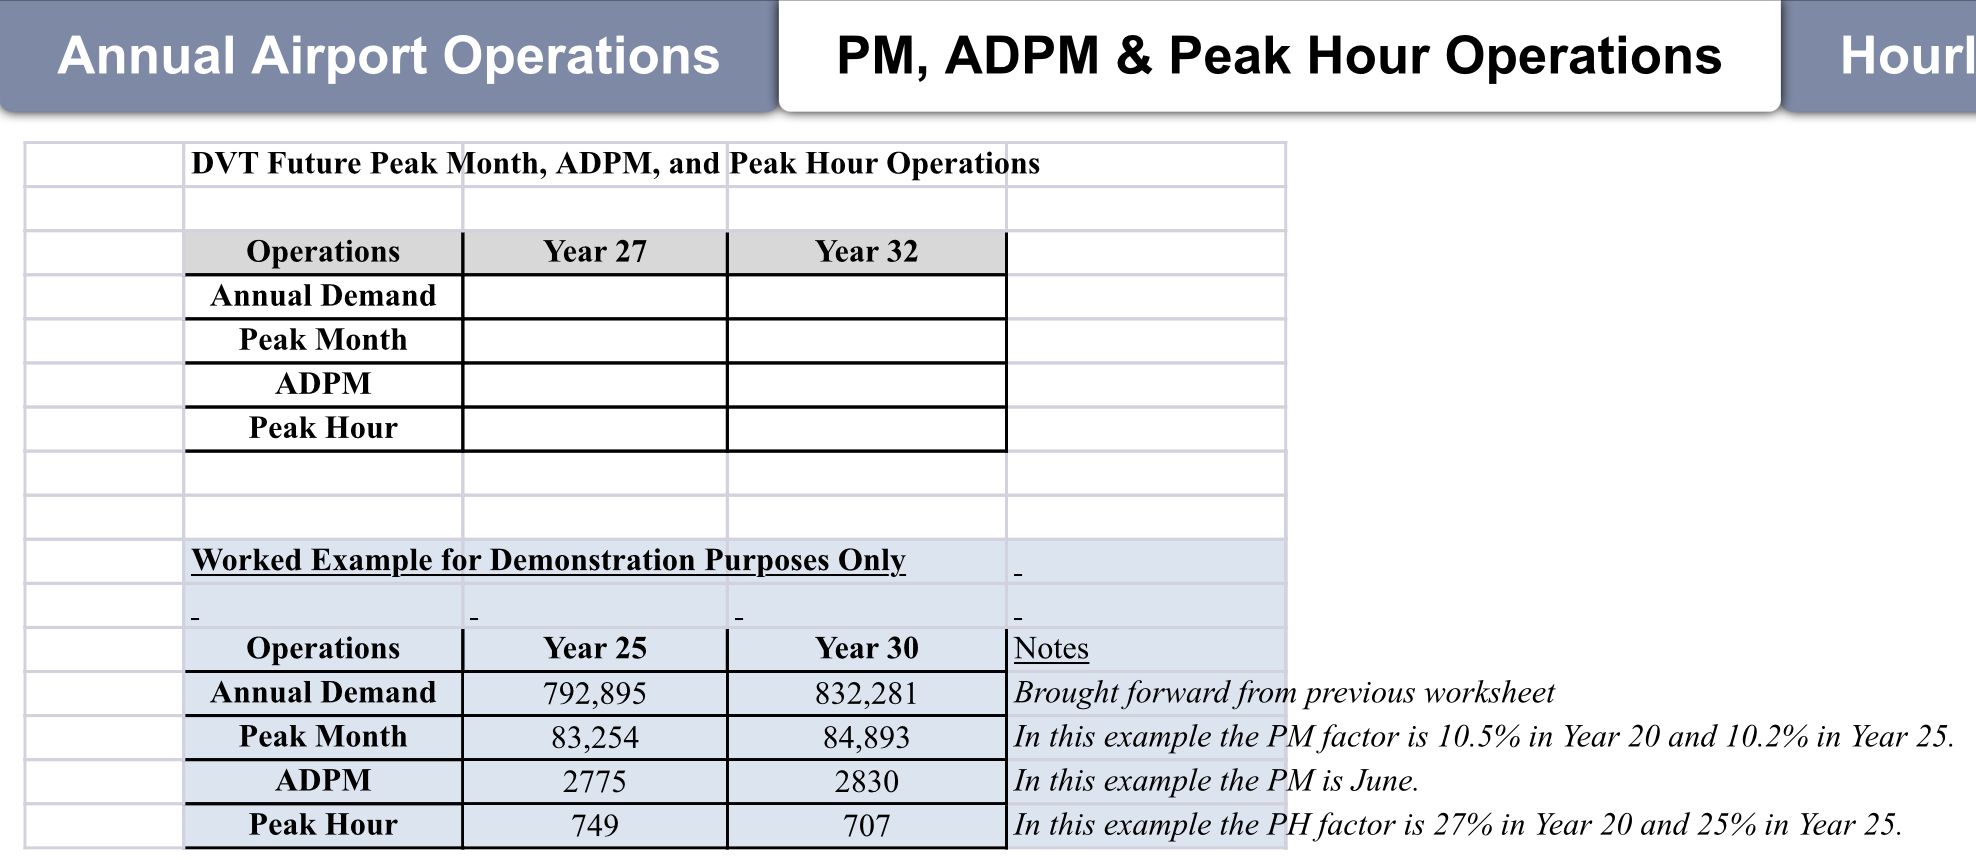
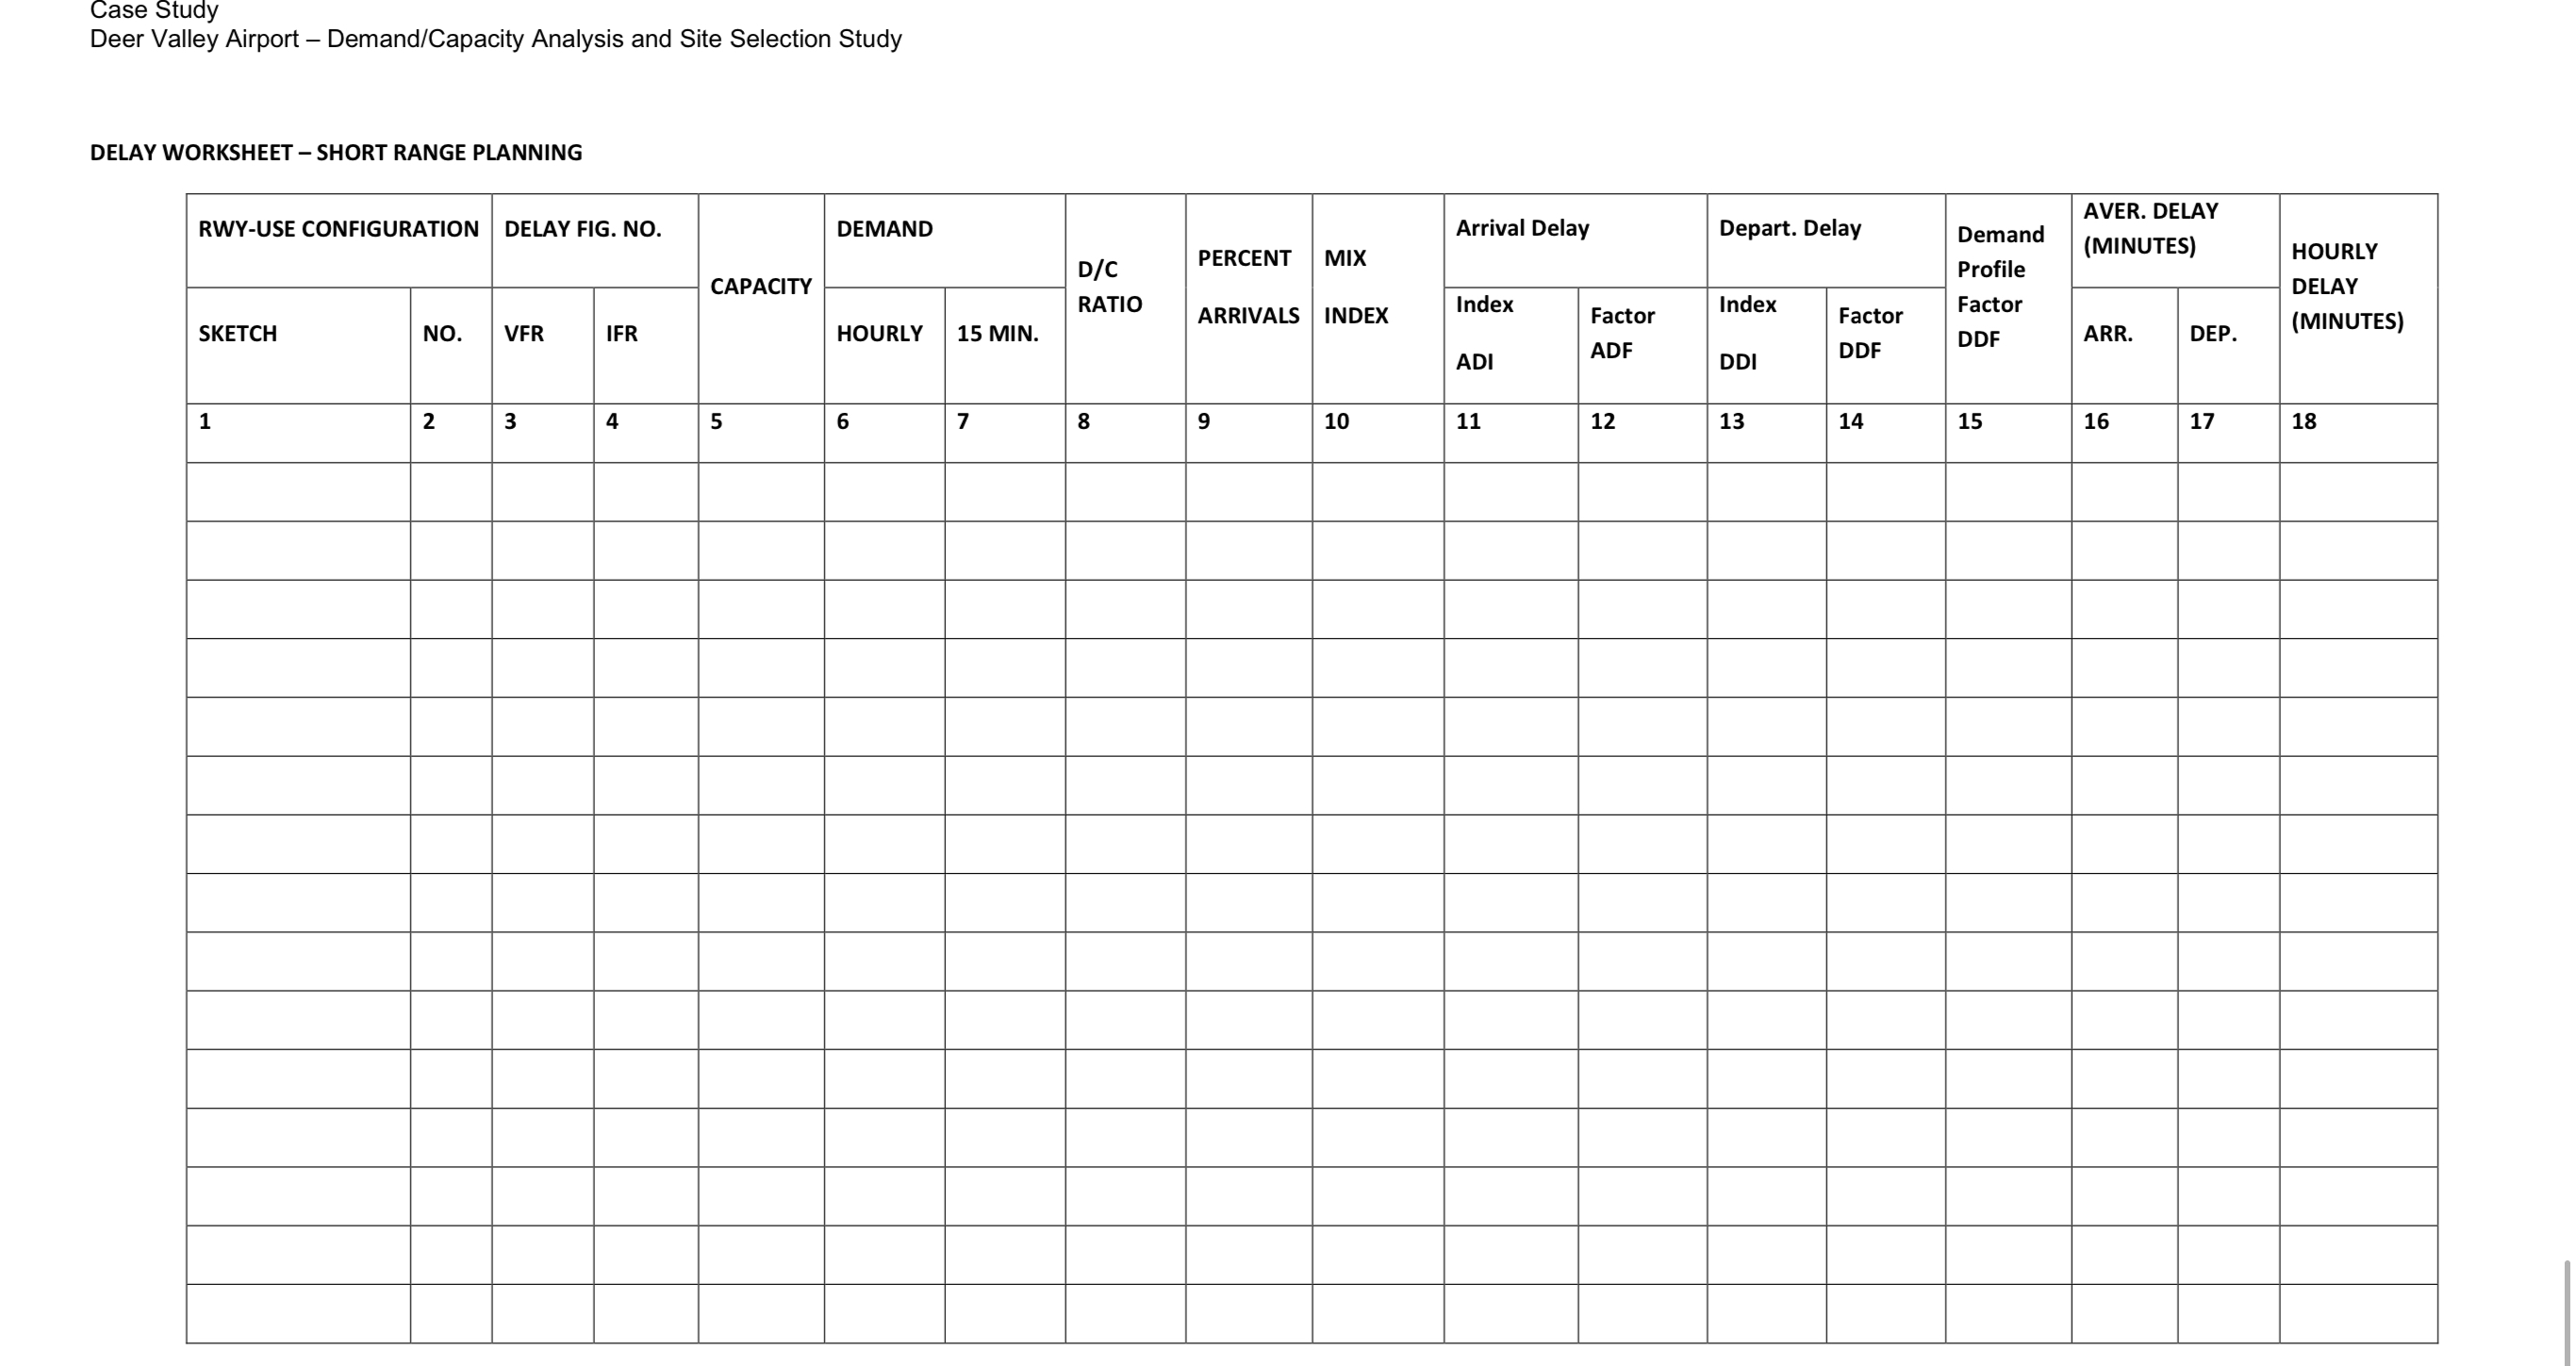
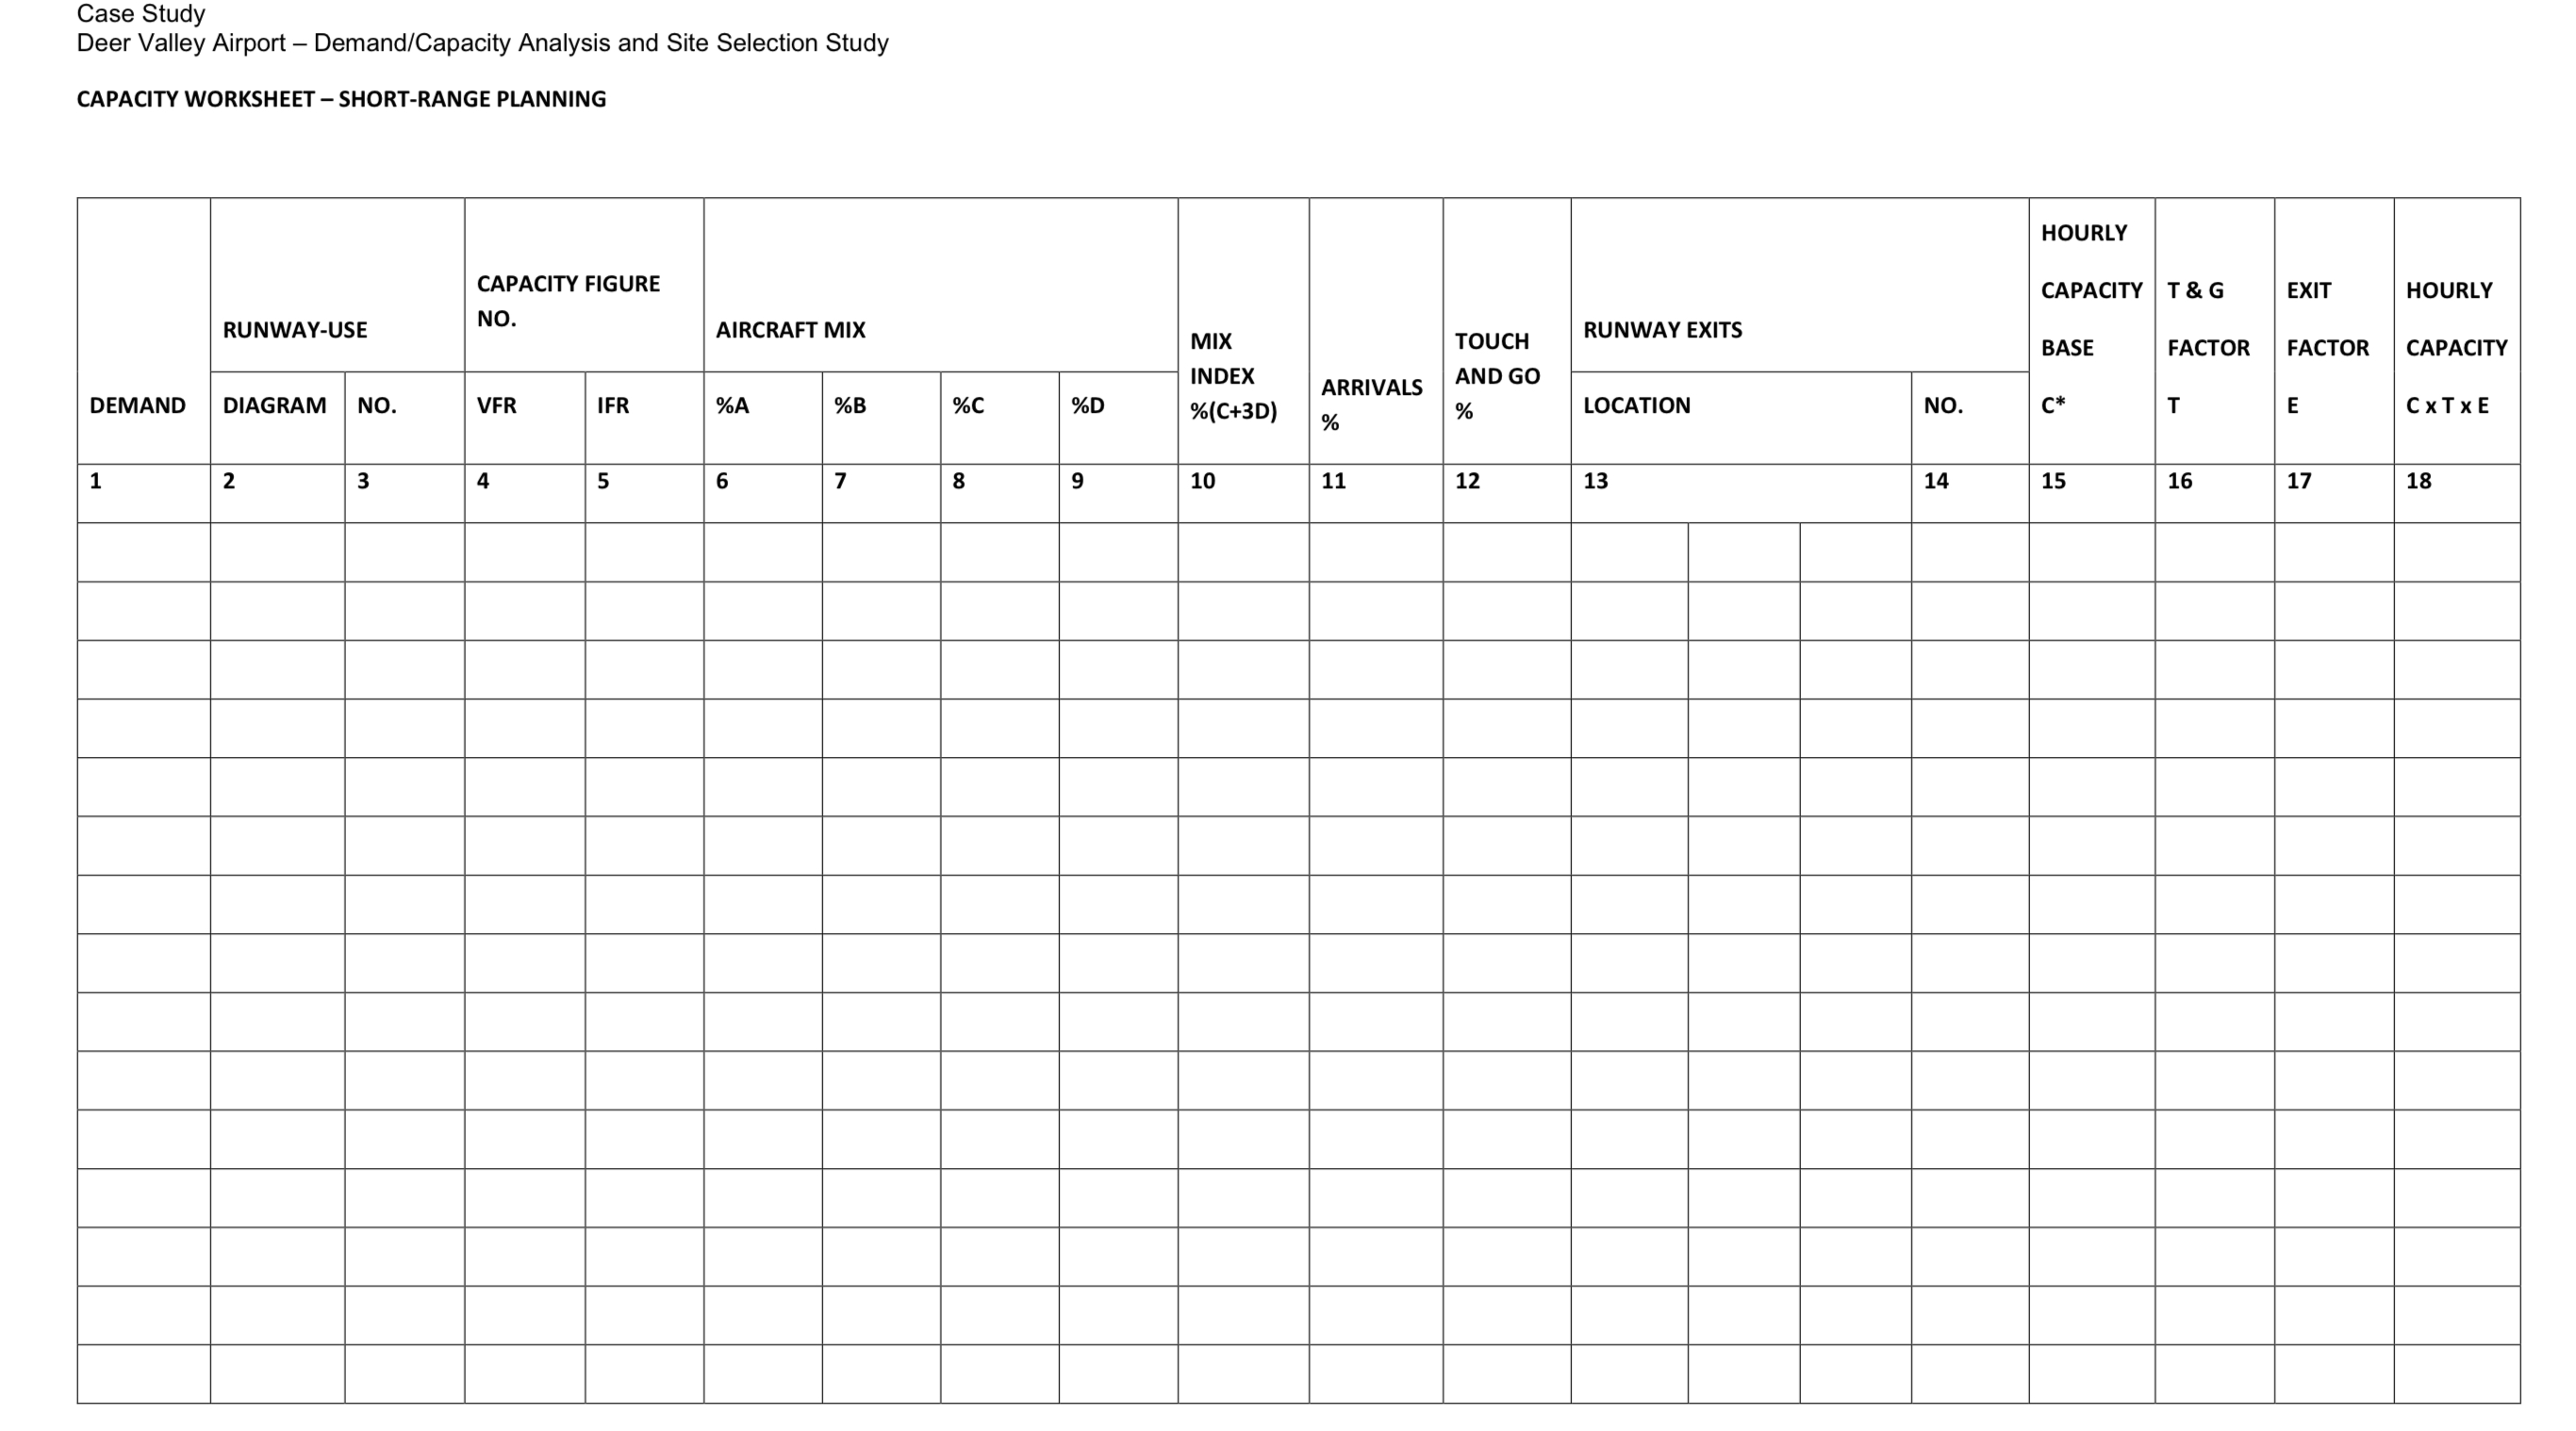
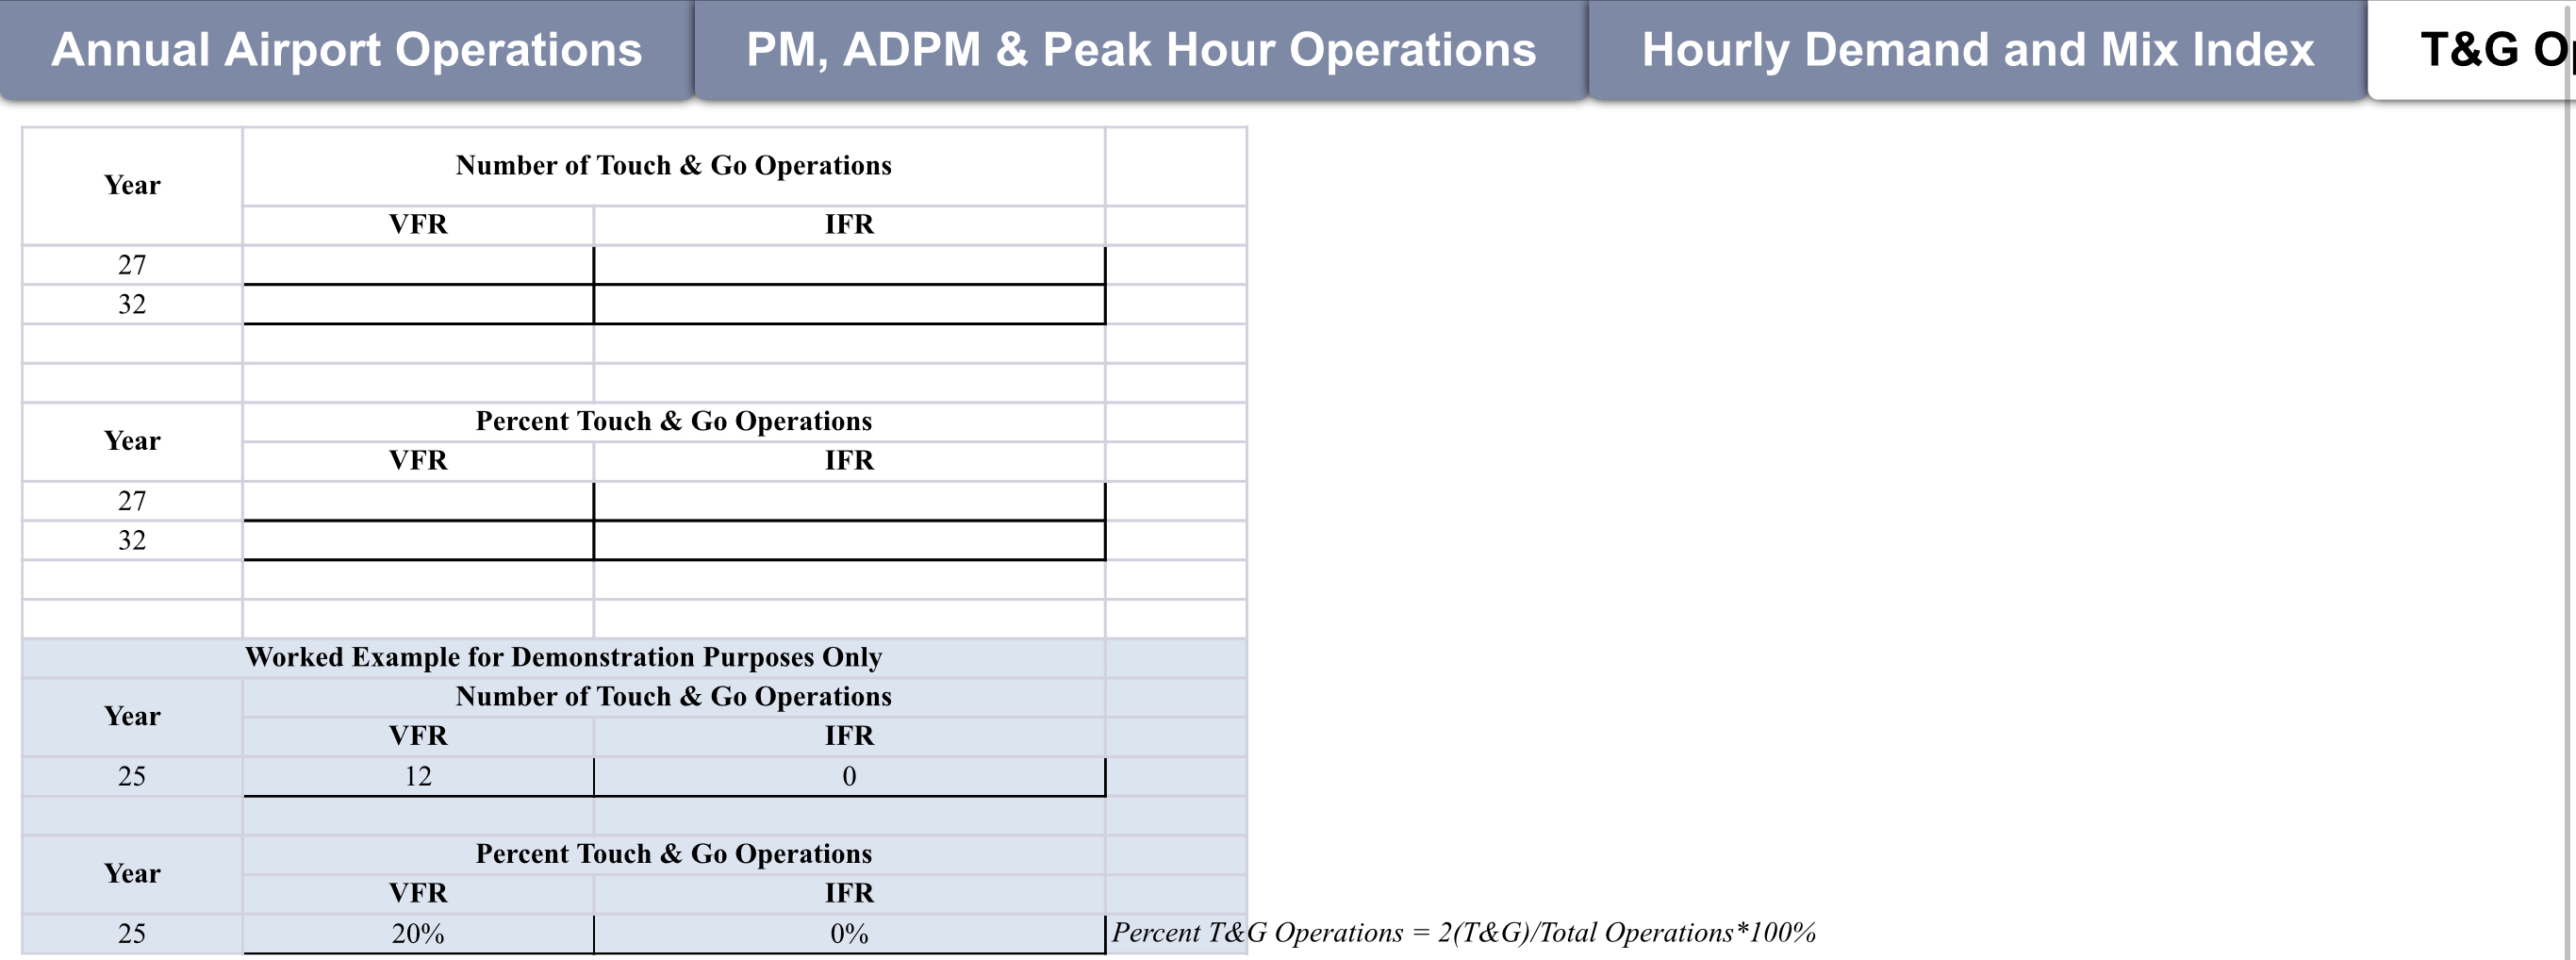
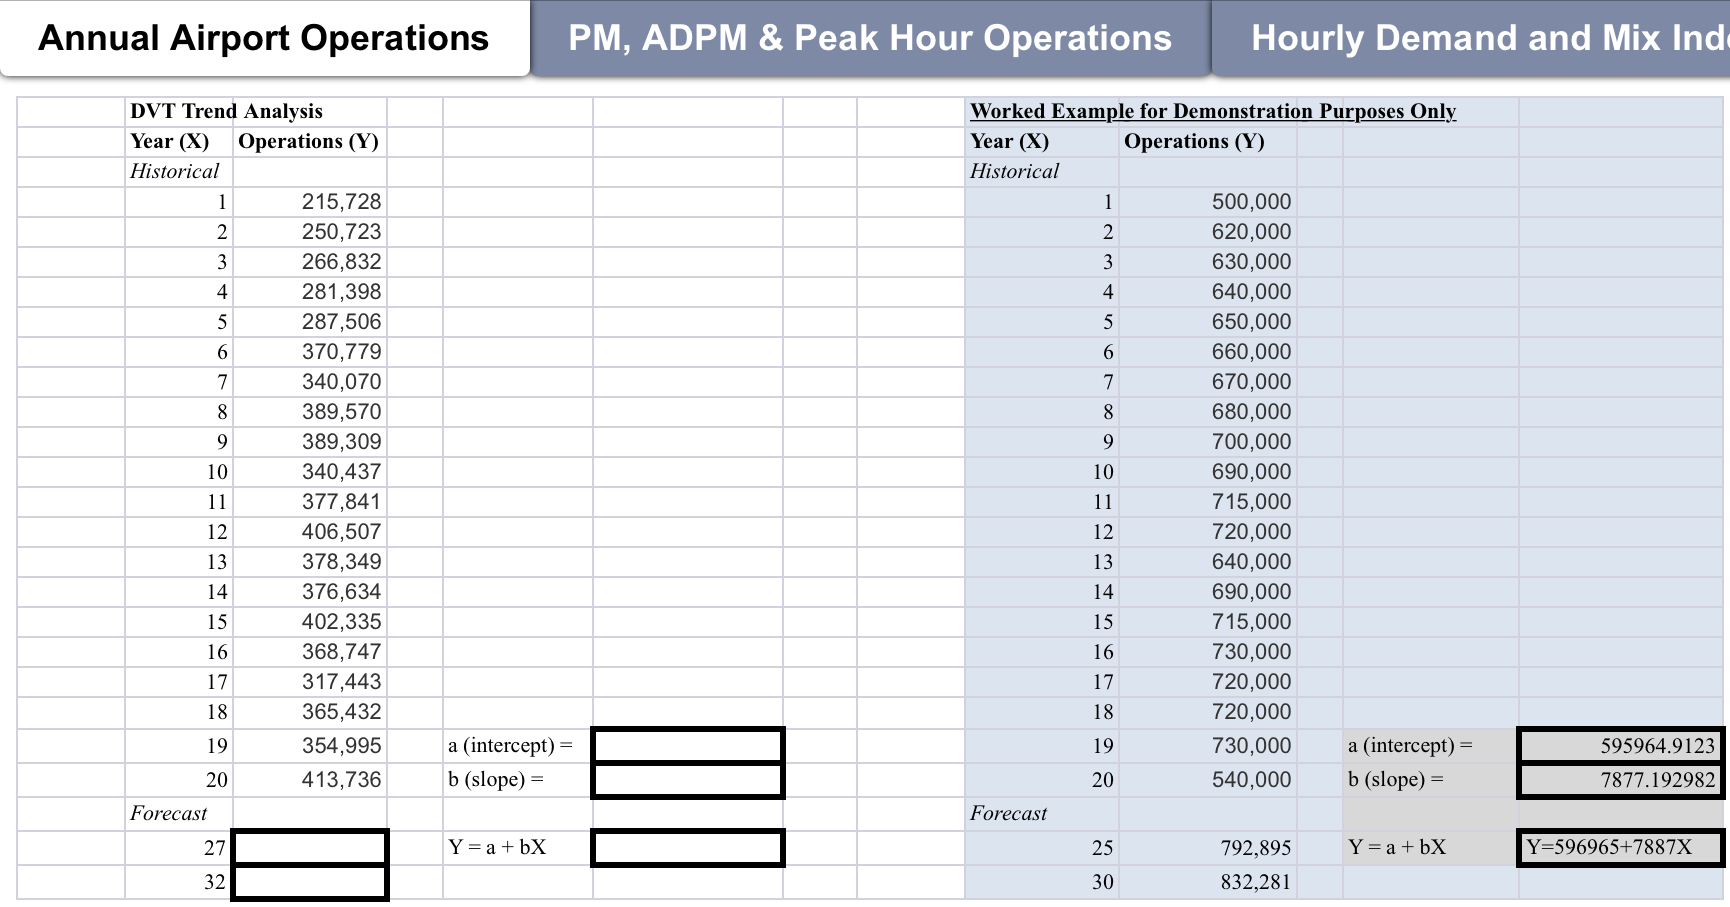
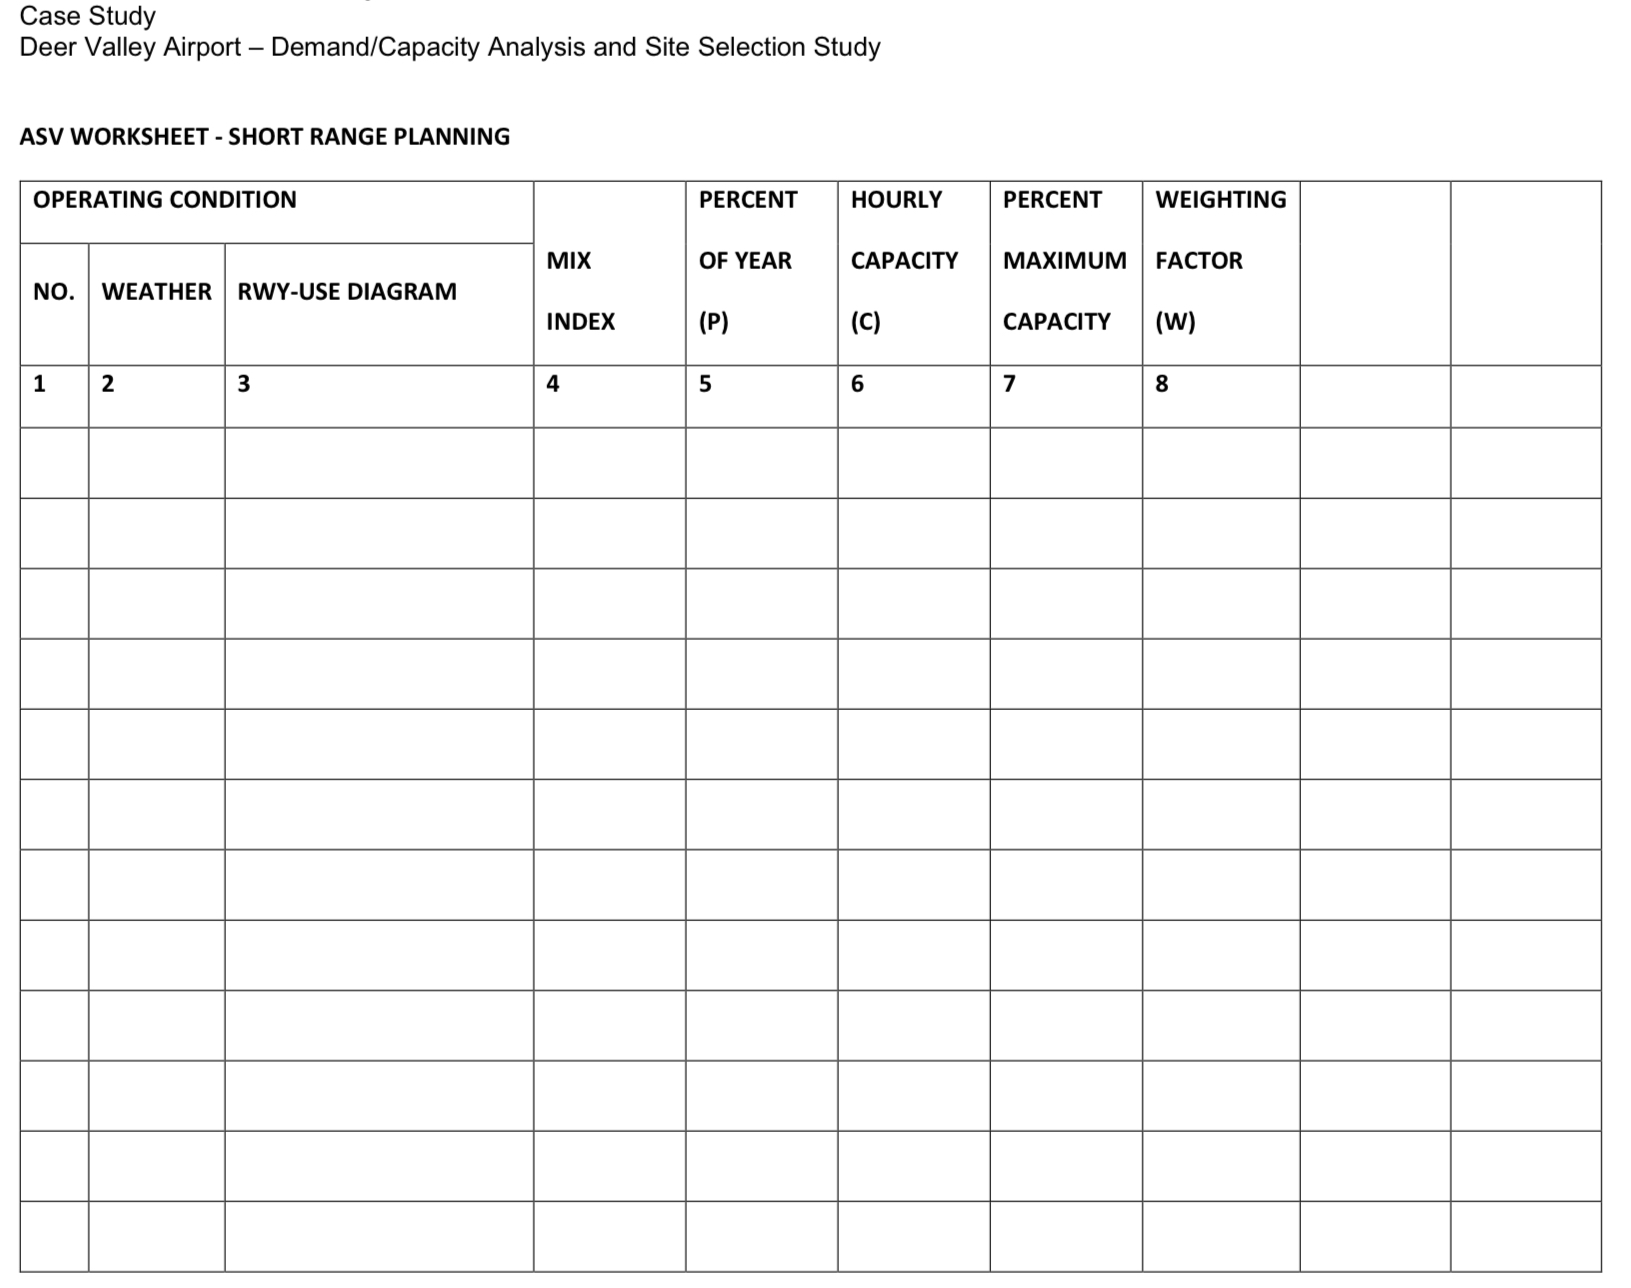
Annual Airport Operations PM, ADPM & Peak Hour Operations DVT Future Peak Month, ADPM, and Peak Hour Operations Operations Annual Demand Peak Month Peak Hour Worked Example for Demonstration Purposes Only Operations Year 25 Year 30 Notes Annual Demand 792,895 832,281 Brought forward from previous worksheet Peak Month 83,254 84,893 In this example the PM factor is 10.5% in Year 20 and 10.2% in Year 25. ADPM 2775 2830 In this example the PM is June. Peak Hour In this example the PH factor is 27% in Year 20 and 25% in Year 25. 2:20 PM Thu Dec 10 @ 90% Done DVT_Case_Study (2 of 221) Annual Airport Operations PM, ADPM & Peak Hour Operations Hourly Demand and Mix Index T&G Ops Peak 15 minute demand Hourly C CAPACITY FIGURE HOURLY NO. CAPACITY RUNWAY-USE AIRCRAFT MIX MIX INDEX TOUCH AND % (C+3D) GO % RUNWAY EXITS DEMAND BASE DIAGRAM NO. VFR IFR % A % B %C % D ARRIVALS 2 % LOCATION 3 4 NO. C 5 6 7 8 9 10 11 12 13 14 15Annual Airport Operations PM, ADPM & Peak Hour Operations Hourly Demand and Mix Index T&G Ops Peak 15 minute demand Hourly Ca RWY-USE CONFIGURATION DELAY FIG. NO. DEMAND PERCENT MIX Arrival Delay Depart. Delay Demand CAPACITY AVER. DELAY (MINUTES) Profile HOURLY D/C RATIO SKETCH NO. VFR IFR HOURLY 15 MIN. ARRIVALS INDEX Index Factor Index Factor DELAY ADI ADF DDI Factor DDF DDF ARR. DEP. (MINUTE 5 8 9 10 11 12 13 14 15 16 17 18Annual Airport Operations PM, ADPM & Peak Hour Operations Hourly Demand and Mix Index T&G Ops Peak 15 minute demand Hourly Ca CAPACITY FIGURE NO. HOURLY AIRCRAFT MIX MIX INDEX CAPACITY TOUCH AND T & G EXIT HOURLY (C+3D) NO. VFR GO % RUNWAY EXITS IFR %A % B %C BASE % D ARRIVALS FACTOR FACTOR CAPACITY 3 5 % 6 LOCATION 7 8 9 10 NO. C* 11 12 E C x T XE 13 14 15 16 17 18\fAnnual Airport Operations PM, ADPM & Peak Hour Operations Hourly Demand and Mix Index T&G Ops Peak 15 n Hourly Demand Year 27 Hourly Demand Year 32 Worked Example for Demonstration Purposes Only Aircraft Class Number of Aircraft Operations Year 25 Aircraft Class Number of Aircraft Operations Number of Aircraft Operations VFR Aircraft Class IFR VFR IFR VFR IFR A A A 60 25 B B B 30 15 C 20 20 D D D 10 10 Total Total Total 120 70 Aircraft Mix VFR IFR Aircraft Mix VFR IFR Aircraft Mix VFR IFR % A %A %A 50.0% 35.7% %B %B %B 25.0% 21.4% %C % C 16.7% 28.6% %D %D 8.3% 14.3% Mix Index Mix Index Mix Index 41.7% 71.4% Mix Index = %C+3%DCase Study Deer Valley Airport - Demand/Capacity Analysis and Site Selection Study DELAY WORKSHEET - SHORT RANGE PLANNING AVER. DELAY RWY-USE CONFIGURATION DELAY FIG. NO. DEMAND Arrival Delay Depart. Delay Demand PERCENT (MINUTES) HOURLY /C MIX Profile CAPACITY DELAY RATIO ARRIVALS INDEX Index Factor Index Factor Factor SKETCH NO. VFR IFR HOURLY 15 MIN. DDF ARR. DEP. (MINUTES) ADI ADF DDI DD 1 2 3 4 5 6 7 8 9 10 11 12 13 14 15 16 17 18Case Study Deer Valley Airport - Demand/Capacity Analysis and Site Selection Study CAPACITY WORKSHEET - SHORT-RANGE PLANNING HOURLY CAPACITY FIGURE CAPACITY T & G EXIT HOURLY RUNWAY-USE NO. AIRCRAFT MIX MIX TOUCH RUNWAY EXITS BASE FACTOR FACTOR CAPACITY INDEX ARRIVALS AND GO DEMAND DIAGRAM NO. VFR IFR %A % B %C %D %(C+3D) LOCATION NO. C* T F CXTXE 1 2 3 4 5 6 7 8 9 10 11 12 13 14 15 16 17 18Annual Airport Operations PM, ADPM & Peak Hour Operati PERCENT HOURLY PERCENT WEIGHTING OPERATING CONDITION OF MIX CAPACITY MAXIMUM FACTOR YEAR RWY-USE NO. WEATHER INDEX DIAGRAM (P) (C) CAPACITY (W) 2 3 4 5 6 7 8Annual Airport Operations PM, ADPM & Peak Hour Operations Hourly Demand and Mix Index T&G O Year Number of Touch & Go Operations VFR IFR 27 32 Year Percent Touch & Go Operations VFR IFR 27 32 Worked Example for Demonstration Purposes Only Year Number of Touch & Go Operations VFR IFR 25 12 0 Year Percent Touch & Go Operations VFR IFR 25 20% 0% Percent T&G Operations = 2(T&G)/Total Operations *100%Annual Airport Operations PM, ADPM & Peak Hour Operations Hourly Demand and Mix Ind DVT Trend Analysis Worked Example for Demonstration Purposes Only Year (X) Operations (Y) Year (X) Operations (Y) Historical Historical 215,728 500,000 IN 250,723 620,000 266,832 630,000 281,398 640,000 287,506 650,000 DO J O UI A W 370,779 660,000 340,070 670,000 389,570 680,000 389,309 9 700,000 10 340,437 10 690,000 11 377,841 11 715,000 12 406,507 12 720,000 13 378,349 13 640,000 14 376,634 14 690,000 15 402,335 15 715,000 16 368,747 16 730,000 17 317,443 17 720,000 18 365,432 18 720,000 19 354,995 a (intercept) = 19 730,000 a (intercept) = 595964.9123 20 413,736 b (slope) = 20 540,000 b (slope) = 7877.192982 Forecast Forecast 27 Y = a + bX 25 792,895 Y = a + bX Y=596965+7887X 32 30 832,281Case Study Deer Valley Airport DemandlCapacity Analysis and Site Selection Study ASV WORKSHEET - SHORT RANGE PLANNING OPERATING CONDITION PERCENT OF YEAR HOURLY CAPACITY PERCENT WEIGHTING MAXIMUM FACTOR
