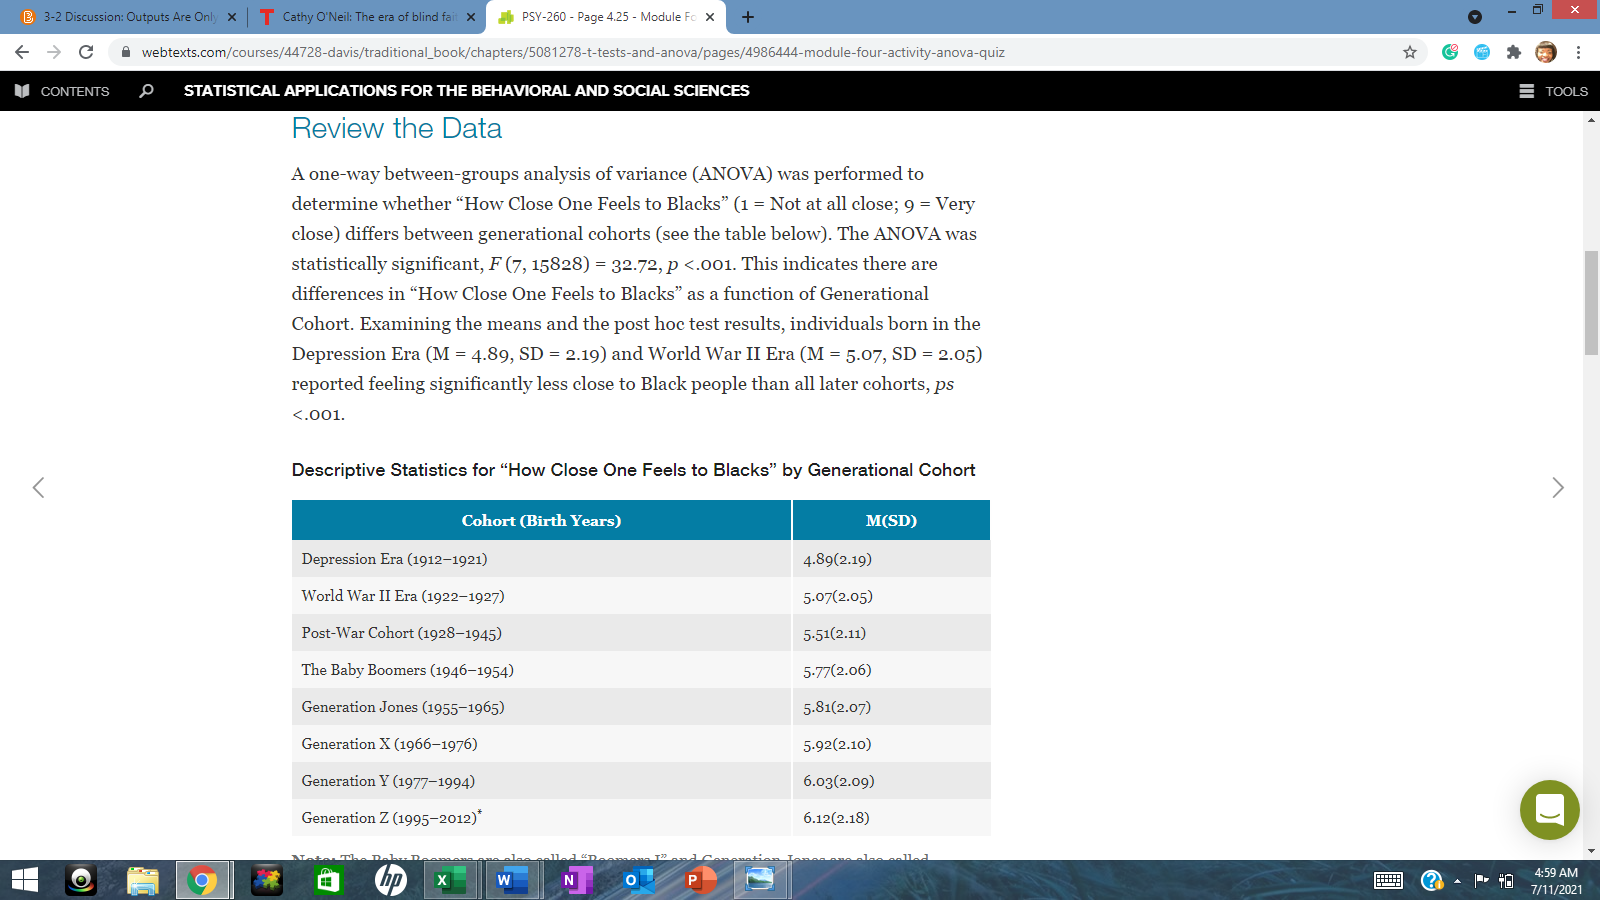
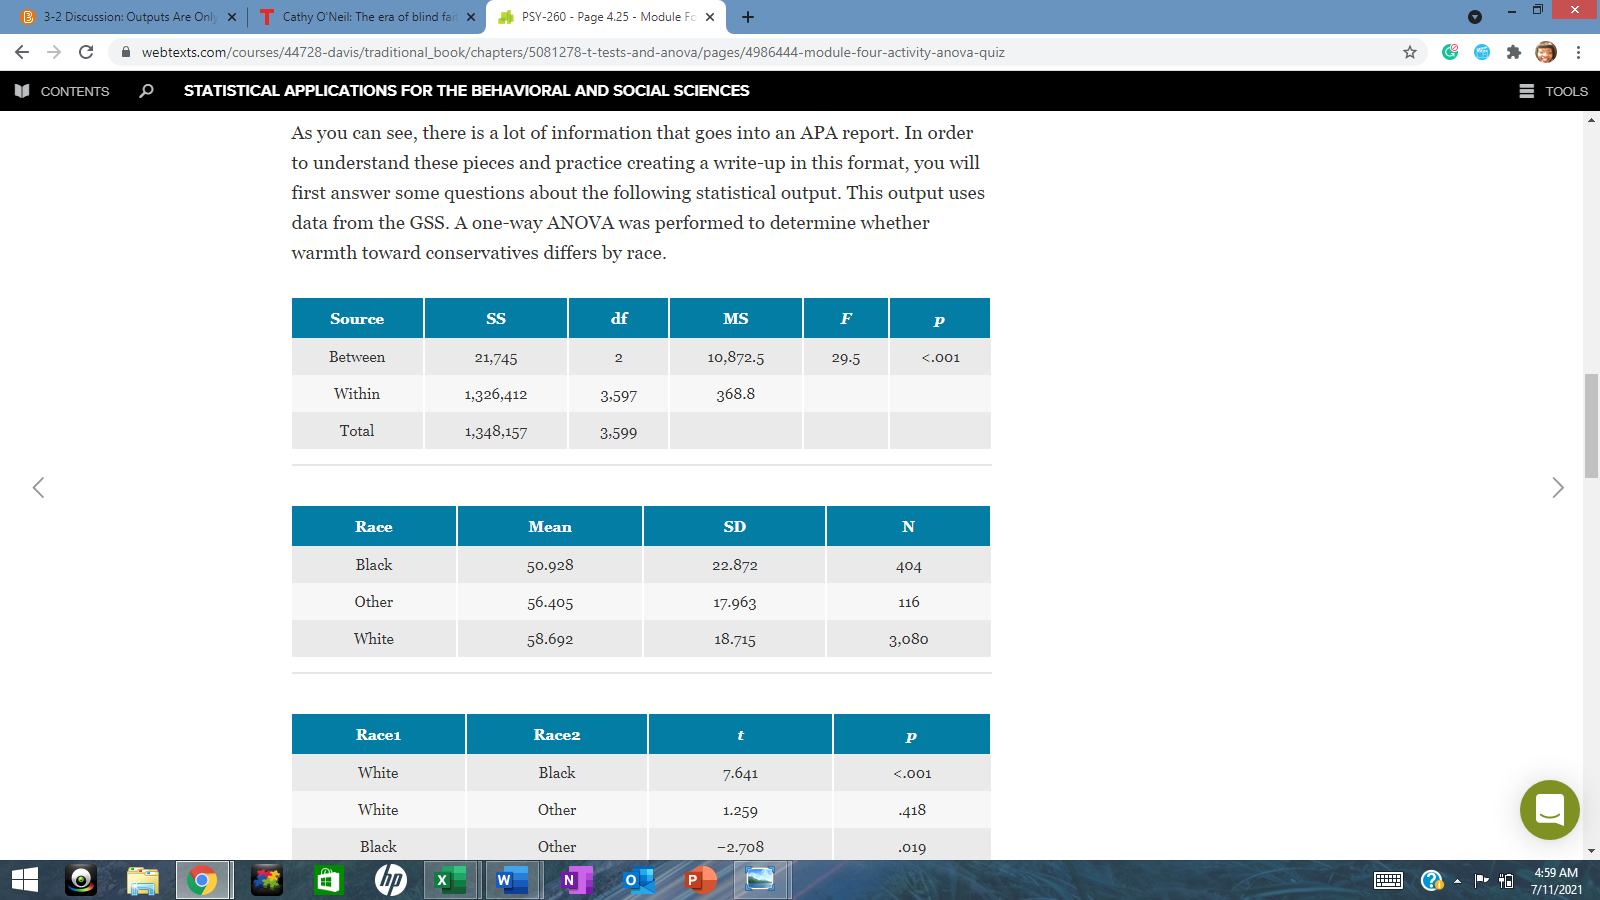
B 3-2 Discussion: Outputs Are Only x T Cathy O'Neil: The era of blind fait X PSY-260 - Page 4.25 - Module Fo X + X - > C A webtexts.com/courses/44728-davis/traditional_book/chapters/5081278-t-tests-and-anova/pages/4986444-module-four-activity-anova-quiz CONTENTS 9 STATISTICAL APPLICATIONS FOR THE BEHAVIORAL AND SOCIAL SCIENCES TOOLS Review the Data A one-way between-groups analysis of variance (ANOVA) was performed to determine whether "How Close One Feels to Blacks" (1 = Not at all close; 9 = Very close) differs between generational cohorts (see the table below). The ANOVA was statistically significant, F (7, 15828) = 32.72, p <.001. this indicates there are differences in close one feels to blacks as a function of generational cohort. examining the means and post hoc test results individuals born depression era sd="2.19)" world war ii reported feeling significantly less black people than all later cohorts ps descriptive statistics for by cohort> Cohort (Birth Years) M(SD) Depression Era (1912-1921) 4.89(2.19) World War II Era (1922-1927) 5.07(2.05) Post-War Cohort (1928-1945) 5-51(2.11) The Baby Boomers (1946-1954) 5.77(2.06) Generation Jones (1955-1965) 5.81(2.07) Generation X (1966-1976) 5.92(2.10) Generation Y (1977-1994) 6.03(2.09) Generation Z (1995-2012)* 6.12(2.18) O 9 W N O P 28 - - TO 4:59 AM 7/11/2021B 3-2 Discussion: Outputs Are Only x T Cathy O'Neil: The era of blind fait X PSY-260 - Page 4.25 - Module Fo X + X - > C A webtexts.com/courses/44728-davis/traditional_book/chapters/5081278-t-tests-and-anova/pages/4986444-module-four-activity-anova-quiz CONTENTS 9 STATISTICAL APPLICATIONS FOR THE BEHAVIORAL AND SOCIAL SCIENCES TOOLS As you can see, there is a lot of information that goes into an APA report. In order to understand these pieces and practice creating a write-up in this format, you will first answer some questions about the following statistical output. This output uses data from the GSS. A one-way ANOVA was performed to determine whether warmth toward conservatives differs by race. Source SS df MS F P Between 21,745 2 10,872.5 29.5 <.001 within total> Race Mean SD N Black 50.928 22.872 404 Other 56.405 17.963 116 White 58.692 18.715 3,080 Race1 Race2 P White Black 7.641 <.001 white other .418 black o hp x w n p to am>


