

Question
b) Calculate the real exchange rate, nominal effective and real effective exchange rates using the given data. Data selection is based on your last digit
b) Calculate the real exchange rate, nominal effective and real effective exchange rates using the given data. Data selection is based on your last digit of the R. No. For example, if your last digit is 0, use data set 0,For effective exchange rate calculation, use data set for EE rate and assume that Pakistan trade share with USA is 40% and China is 60%.
c )Analyze the relationship between the exchange rates calculated in the part (b) using graph.
c) 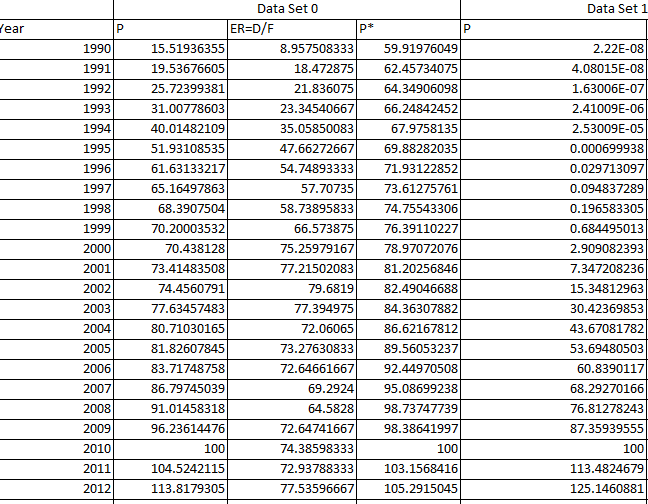
just use the data set 0
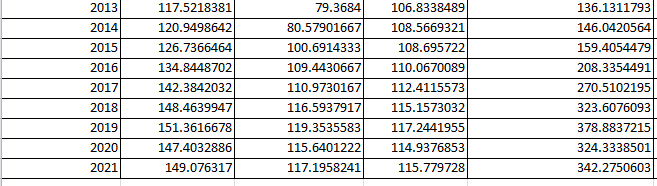
Data Set 1 Pear P p* P 1990 1991 1992 1993 1994 1995 1996 1997 1998 1999 Data Set 0 ER=D/F 15.51936355 8.957508333 19.53676605 18.472875 25.72399381 21.836075 31.00778603 23.34540667 40.01482109 35.05850083 51.93108535 47.66272667 61.63133217 54.74893333 65.16497863 57.70735 68.3907504 58.73895833 70.20003532 66.573875 70.438128) 75.25979167 73.41483508 77.21502083 74.4560791 79.6819 77.63457483 77.394975 80.71030165 72.06065 81.82607845 73.27630833 83.71748758 72.64661667 86.79745039 69.2924 91.01458318 64.5828 59.91976049 62.45734075 64.34906098 66.24842452 67.9758135 69.88282035 71.93122852 73.61275761 74.75543306 76.391102271 78.97072076 2.22E-08 4.08015E-08 1.63006E-07 2.41009E-06 2.53009E-05 0.000699938 0.029713097 0.094837289 0.196583305 0.684495013 2.909082393 7.347208236 15.34812963 30.42369853 2000 2001 2002 2003 2004 81.20256846 82.49046688 84.36307882 86.62167812 89.56053237 92.44970508 95.08699238 2005 2006 2007 98.73747739 2008 2009 2010 43.67081782 53.69480503 60.8390117 68.29270166 76.81278243 87.35939555 100 113.4824679 125.1460881 96.23614476 100 104.5242115 113.8179305 72.64741667 74.38598333 72.93788333 77.53596667 98.38641997 100 103.1568416 105.2915045 2011 2012 2013 117.5218381 79.3684 2014 106.8338489 108.5669321 108.695722 110.0670089 2015 120.9498642 126.7366464 134.8448702 142.3842032 148.4639947 2016 136.1311793 146.0420564 159.4054479 208.3354491 270.5102195 323.6076093 112.4115573 80.57901667 100.6914333 109.4430667 110.9730167 116.5937917 119.3535583 115.6401222 117.1958241 2017 2018 115.1573032 2019 378.8837215 2020 2021 151.3616678 147.4032886 149.076317 117.2441955 114.9376853 115.779728 324.3338501 342.2750603 Data Set 1 Pear P p* P 1990 1991 1992 1993 1994 1995 1996 1997 1998 1999 Data Set 0 ER=D/F 15.51936355 8.957508333 19.53676605 18.472875 25.72399381 21.836075 31.00778603 23.34540667 40.01482109 35.05850083 51.93108535 47.66272667 61.63133217 54.74893333 65.16497863 57.70735 68.3907504 58.73895833 70.20003532 66.573875 70.438128) 75.25979167 73.41483508 77.21502083 74.4560791 79.6819 77.63457483 77.394975 80.71030165 72.06065 81.82607845 73.27630833 83.71748758 72.64661667 86.79745039 69.2924 91.01458318 64.5828 59.91976049 62.45734075 64.34906098 66.24842452 67.9758135 69.88282035 71.93122852 73.61275761 74.75543306 76.391102271 78.97072076 2.22E-08 4.08015E-08 1.63006E-07 2.41009E-06 2.53009E-05 0.000699938 0.029713097 0.094837289 0.196583305 0.684495013 2.909082393 7.347208236 15.34812963 30.42369853 2000 2001 2002 2003 2004 81.20256846 82.49046688 84.36307882 86.62167812 89.56053237 92.44970508 95.08699238 2005 2006 2007 98.73747739 2008 2009 2010 43.67081782 53.69480503 60.8390117 68.29270166 76.81278243 87.35939555 100 113.4824679 125.1460881 96.23614476 100 104.5242115 113.8179305 72.64741667 74.38598333 72.93788333 77.53596667 98.38641997 100 103.1568416 105.2915045 2011 2012 2013 117.5218381 79.3684 2014 106.8338489 108.5669321 108.695722 110.0670089 2015 120.9498642 126.7366464 134.8448702 142.3842032 148.4639947 2016 136.1311793 146.0420564 159.4054479 208.3354491 270.5102195 323.6076093 112.4115573 80.57901667 100.6914333 109.4430667 110.9730167 116.5937917 119.3535583 115.6401222 117.1958241 2017 2018 115.1573032 2019 378.8837215 2020 2021 151.3616678 147.4032886 149.076317 117.2441955 114.9376853 115.779728 324.3338501 342.2750603Step by Step Solution
There are 3 Steps involved in it
Step: 1

Get Instant Access to Expert-Tailored Solutions
See step-by-step solutions with expert insights and AI powered tools for academic success
Step: 2

Step: 3
Ace Your Homework with AI
Get the answers you need in no time with our AI-driven, step-by-step assistance
Get Started
Guide To Investing In Rental Properties
Authors: Dennis Mulongo
1st Edition
979-8424909191