

Answered step by step
Verified Expert Solution
Question
1 Approved Answer
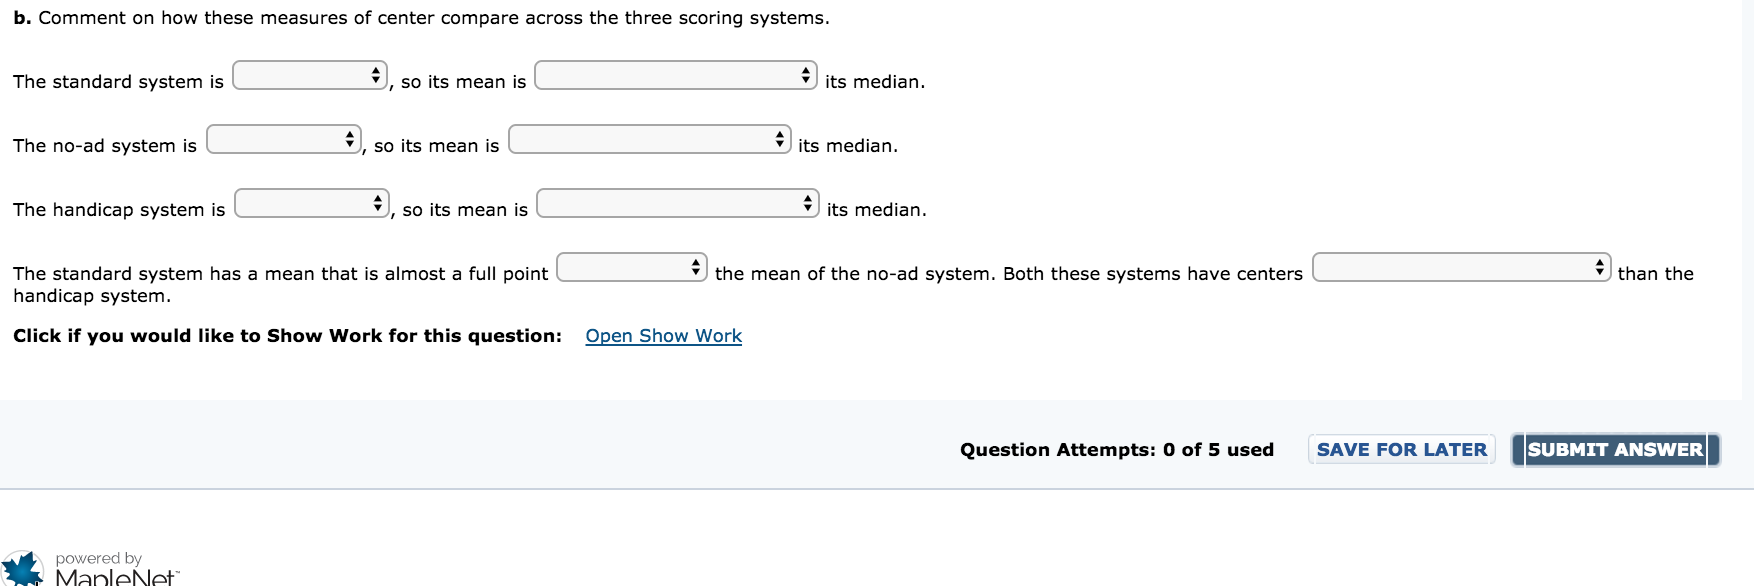
b. Comment on how these measures of center compare across the three scoring systems. The standard system is S, so its mean is E its

Step by Step Solution
There are 3 Steps involved in it
Step: 1

Get Instant Access to Expert-Tailored Solutions
See step-by-step solutions with expert insights and AI powered tools for academic success
Step: 2

Step: 3
Ace Your Homework with AI
Get the answers you need in no time with our AI-driven, step-by-step assistance
Get Started
Introduction to graph theory
Authors: Douglas B. West
2nd edition
131437372, 978-0131437371