Answered step by step
Verified Expert Solution
Link Copied!

Question

1 Approved Answer

b) Consider the following graph in Figure 3 : Figure 3: Nodes Each node shows the h^ value (estimate to the goal) in parentheses after
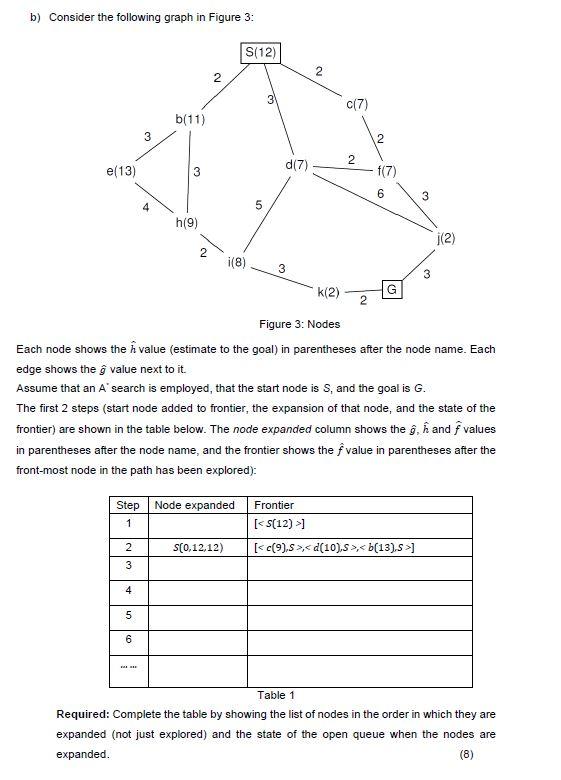
image text in transcribed

b) Consider the following graph in Figure 3 : Figure 3: Nodes Each node shows the h^ value (estimate to the goal) in parentheses after the node name. Each edge shows the g^ value next to it. Assume that an A search is employed, that the start node is S, and the goal is G. The first 2 steps (start node added to frontier, the expansion of that node, and the state of the frontier) are shown in the table below. The node expanded column shows the g^,h^ and f^ values in parentheses after the node name, and the frontier shows the f^ value in parentheses after the front-most node in the path has been explored): Required: Complete the table by showing the list of nodes in the order in which they are expanded (not just explored) and the state of the open queue when the nodes are expanded. (8)

Step by Step Solution

There are 3 Steps involved in it

Step: 1

blur-text-image

Get Instant Access to Expert-Tailored Solutions

See step-by-step solutions with expert insights and AI powered tools for academic success

Step: 2

blur-text-image

Step: 3

blur-text-image

Ace Your Homework with AI

Get the answers you need in no time with our AI-driven, step-by-step assistance

Get Started

Recommended Textbook for

Murach's SQL Server 2012 For Developers

Authors: Bryan Syverson, Joel Murach, Mike Murach

1st Edition

1890774693, 9781890774691

Students also viewed these Databases questions

Question

=+ How well do you think you could do your job?

Answered: 1 week ago