

Answered step by step
Verified Expert Solution
Question
1 Approved Answer
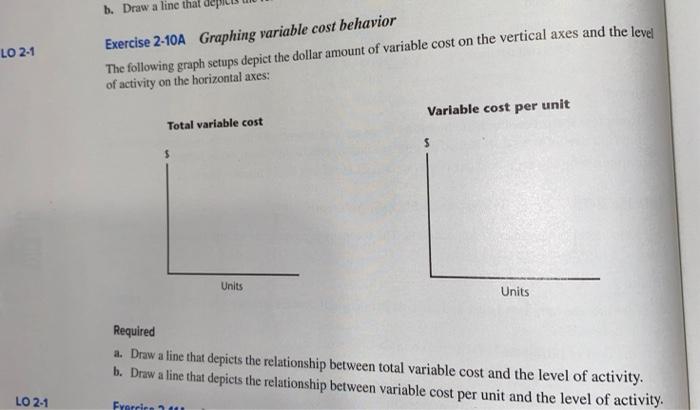
b. Draw a line that de LO 2-1 Exercise 2-10A Graphing variable cost behavior The following graph setups depict the dollar amount of variable cost
Step by Step Solution
There are 3 Steps involved in it
Step: 1

Get Instant Access to Expert-Tailored Solutions
See step-by-step solutions with expert insights and AI powered tools for academic success
Step: 2

Step: 3
Ace Your Homework with AI
Get the answers you need in no time with our AI-driven, step-by-step assistance
Get Started
Stand Up To The IRS How To Handle Audits Tax Bills And Tax Court
Authors: Frederick W. Daily Robin Leonard
2nd Edition
0873372409, 978-0873372404