

Question
(b) The traffic flow in an intersection is shown in the figure below. Data given: Start-up lost time is 3 sec., Saturation headway is
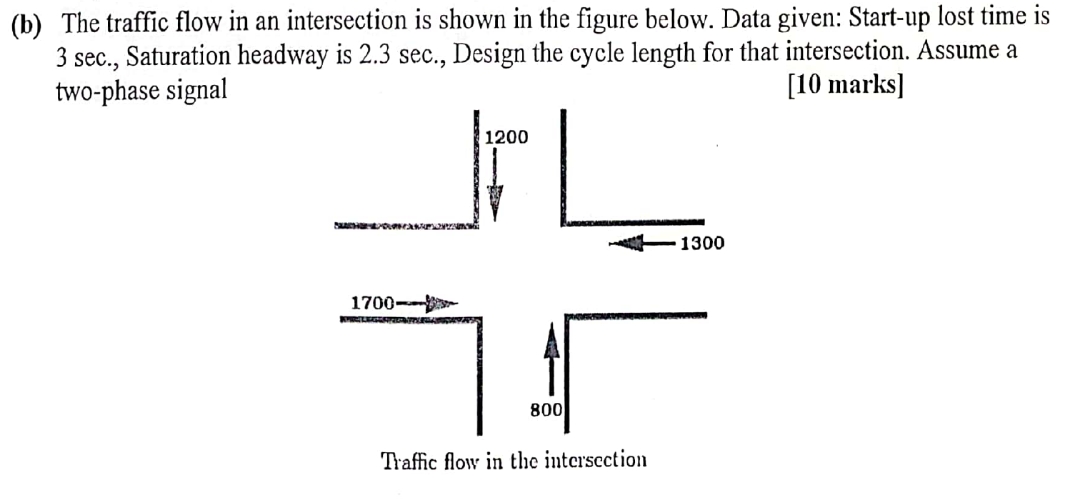
(b) The traffic flow in an intersection is shown in the figure below. Data given: Start-up lost time is 3 sec., Saturation headway is 2.3 sec., Design the cycle length for that intersection. Assume a two-phase signal [10 marks] 1700- 1200 800 Traffic flow in the intersection 1300
Step by Step Solution
There are 3 Steps involved in it
Step: 1
Solutions Givn data Startup lost time 3 sec Saturation headway 3 sec Effective green time 15 sec Ste...
Get Instant Access with AI-Powered Solutions
See step-by-step solutions with expert insights and AI powered tools for academic success
Step: 2

Step: 3
Ace Your Homework with AI
Get the answers you need in no time with our AI-driven, step-by-step assistance
Get Started
Elements Of Chemical Reaction Engineering
Authors: H. Fogler
6th Edition
013548622X, 978-0135486221