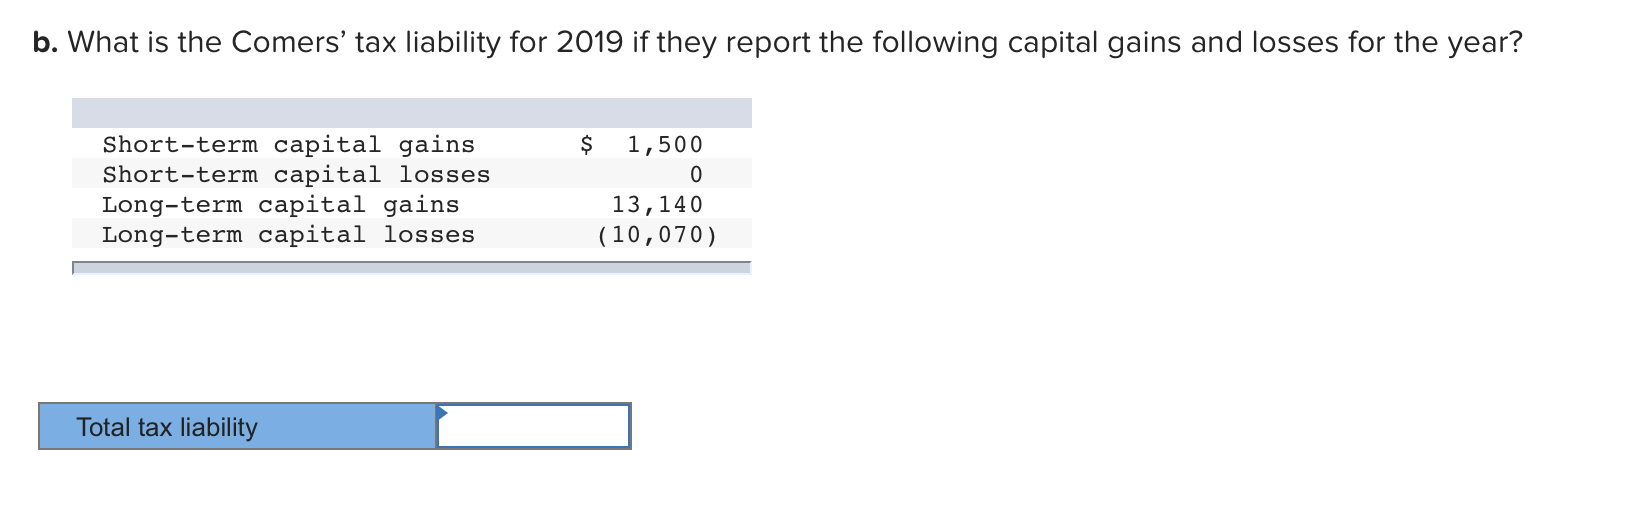
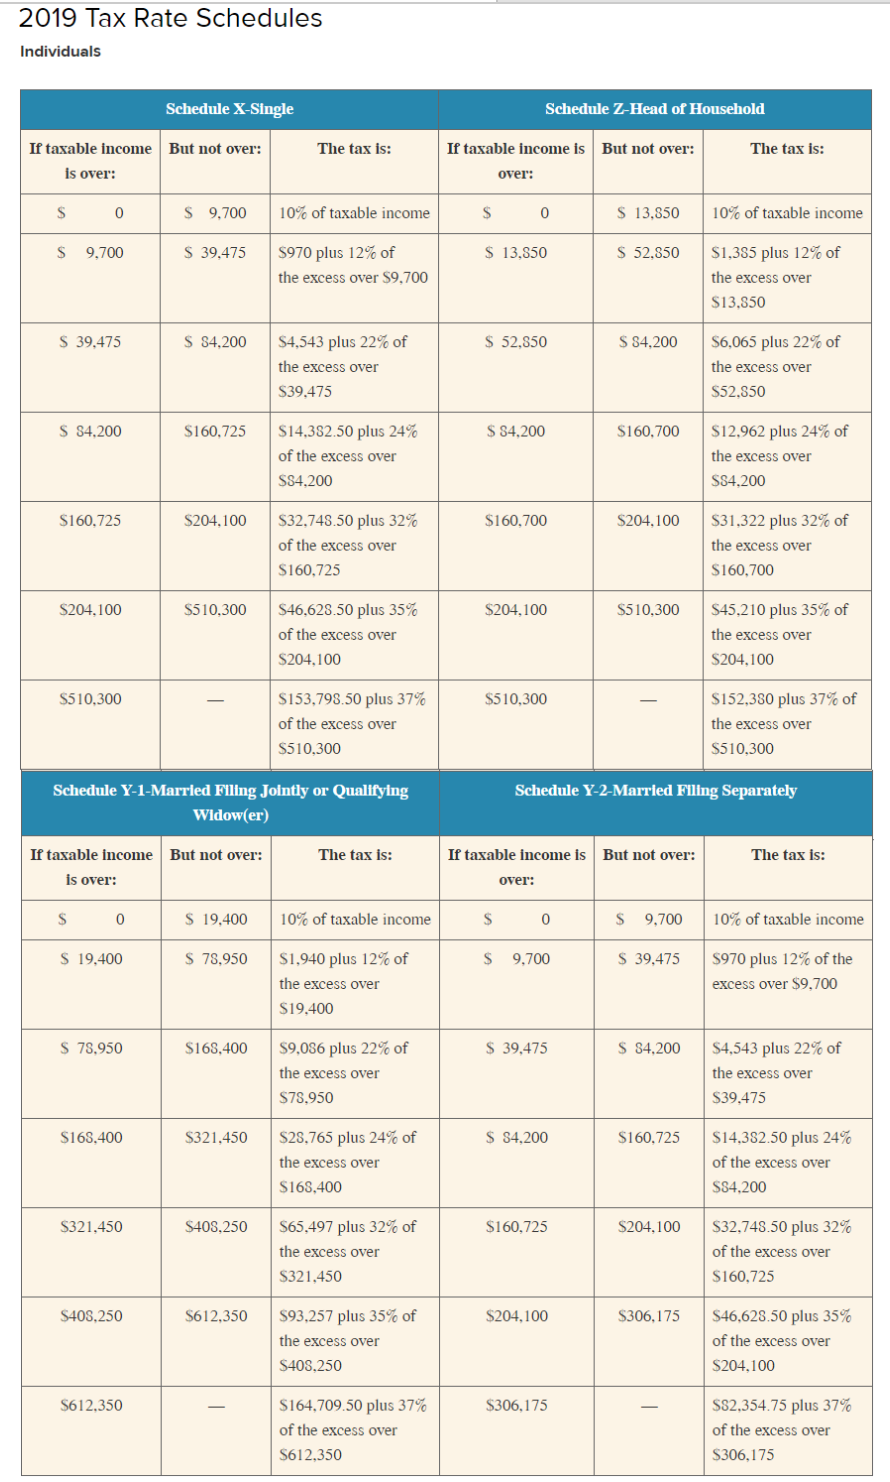
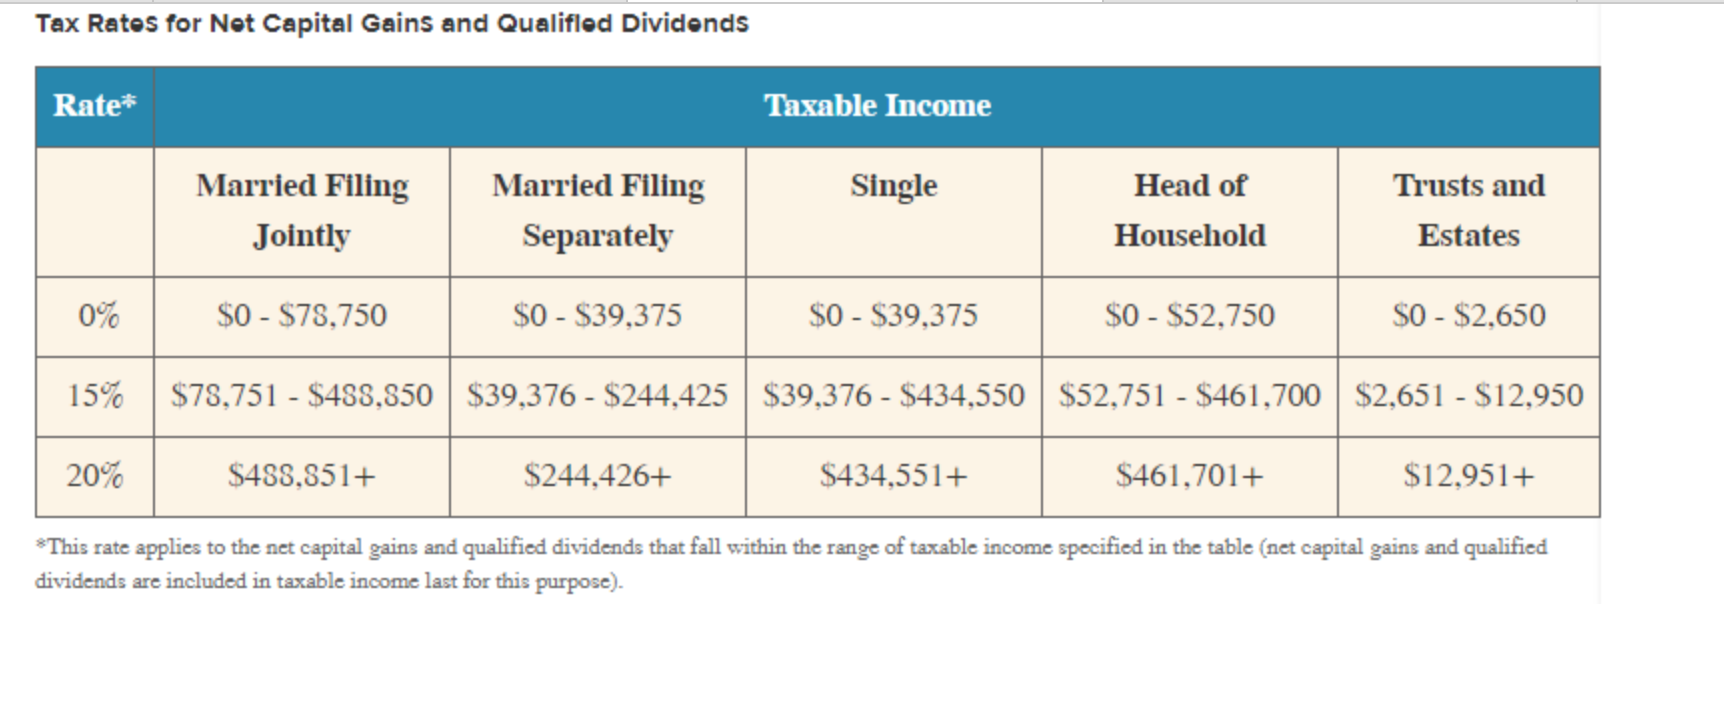
b. What is the Comers' tax liability for 2019 if they report the following capital gains and losses for the year? $ Short-term capital gains Short-term capital losses Long-term capital gains Long-term capital losses 1,500 0 13,140 (10,070) Total tax liability 2019 Tax Rate Schedules Individuals Schedule X-Single Schedule Z-Head of Household The tax is: The tax is: If taxable income But not over: is over: If taxable income is But not over: over: $ 0 $ 9,700 10% of taxable income $ 0 $ 13,850 10% of taxable income $ 9,700 $ 13,850 $ 52,850 S970 plus 12% of the excess over $9,700 $1,355 plus 12% of the excess over $13.550 S 39,475 $ $4,200 $ 52,850 S $4,200 $4,543 plus 22% of the excess over S39,475 $6,065 plus 22% of the excess over $52,850 $ 54,200 $160,725 $ 54,200 $160,700 $14,382.50 plus 24% of the excess over SS4.200 $12,962 plus 24% of the excess over SS4.200 $160.725 S204,100 $160,700 S204.100 $32,748.50 plus 32% of the excess over $160,725 $31,322 plus 32% of the excess over $160,700 S204,100 S510,300 $204,100 S510,300 $46.628.50 plus 35% of the excess over S204,100 $45,210 plus 35% of the excess over S204,100 S510,300 $510,300 S153,798.50 plus 37% of the excess over $510,300 $152,380 plus 37% of the excess over S510,300 Schedule Y-2-Married Filing Separately Schedule Y-1-Married Filing Jointly or Qualifying Widow(er) The tax is: The tax is: If taxable income But not over: is over: If taxable income is But not over: over: $ 0 $ 19,400 10% of taxable income $ 0 S 9,700 10% of taxable income $ 19,400 $ 78,950 $ 9,700 S 39,475 $1,940 plus 12% of the excess over $19.400 $970 plus 12% of the excess over $9,700 $ 78,950 $168,400 $ 39,475 S $4,200 59,056 plus 22% of the excess over S78.950 $4,543 plus 22% of the excess over $39,475 S168.400 S321.450 $ $4,200 $160,725 $28,765 plus 24% of the excess over $168.400 $14,382.50 plus 24% of the excess over SS4.200 S321,450 $408.250 $160,725 S204,100 S65.497 plus 32% of the excess over $321,450 $32,743.50 plus 32% of the excess over $160,725 S408,250 S612,350 $204,100 S306,175 $93,257 plus 35% of the excess over S408,250 S46,628.50 plus 35% of the excess over S204,100 S612.350 $306,175 $164.709.50 plus 37% of the excess over S612,350 SS2.354.75 plus 37% of the excess over S306,175 Tax Rates for Net Capital Gains and Qualified Dividends Rate* Taxable Income Single Married Filing Jointly Married Filing Separately Head of Household Trusts and Estates 0% $0 - $78,750 $0 - $39,375 $0 - $39,375 $0 - $52,750 $0 - $2,650 15% $78,751 - $488,850 $39,376 - $244,425 $39,376 - $434,550 $52,751 - $461,700 $2,651 - $12,950 20% $488,851+ $244,426+ $434,551+ $461,701+ $12.951+ *This rate applies to the net capital gains and qualified dividends that fall within the range of taxable income specified in the table (net capital gains and qualified dividends are included in taxable income last for this purpose). b. What is the Comers' tax liability for 2019 if they report the following capital gains and losses for the year? $ Short-term capital gains Short-term capital losses Long-term capital gains Long-term capital losses 1,500 0 13,140 (10,070) Total tax liability 2019 Tax Rate Schedules Individuals Schedule X-Single Schedule Z-Head of Household The tax is: The tax is: If taxable income But not over: is over: If taxable income is But not over: over: $ 0 $ 9,700 10% of taxable income $ 0 $ 13,850 10% of taxable income $ 9,700 $ 13,850 $ 52,850 S970 plus 12% of the excess over $9,700 $1,355 plus 12% of the excess over $13.550 S 39,475 $ $4,200 $ 52,850 S $4,200 $4,543 plus 22% of the excess over S39,475 $6,065 plus 22% of the excess over $52,850 $ 54,200 $160,725 $ 54,200 $160,700 $14,382.50 plus 24% of the excess over SS4.200 $12,962 plus 24% of the excess over SS4.200 $160.725 S204,100 $160,700 S204.100 $32,748.50 plus 32% of the excess over $160,725 $31,322 plus 32% of the excess over $160,700 S204,100 S510,300 $204,100 S510,300 $46.628.50 plus 35% of the excess over S204,100 $45,210 plus 35% of the excess over S204,100 S510,300 $510,300 S153,798.50 plus 37% of the excess over $510,300 $152,380 plus 37% of the excess over S510,300 Schedule Y-2-Married Filing Separately Schedule Y-1-Married Filing Jointly or Qualifying Widow(er) The tax is: The tax is: If taxable income But not over: is over: If taxable income is But not over: over: $ 0 $ 19,400 10% of taxable income $ 0 S 9,700 10% of taxable income $ 19,400 $ 78,950 $ 9,700 S 39,475 $1,940 plus 12% of the excess over $19.400 $970 plus 12% of the excess over $9,700 $ 78,950 $168,400 $ 39,475 S $4,200 59,056 plus 22% of the excess over S78.950 $4,543 plus 22% of the excess over $39,475 S168.400 S321.450 $ $4,200 $160,725 $28,765 plus 24% of the excess over $168.400 $14,382.50 plus 24% of the excess over SS4.200 S321,450 $408.250 $160,725 S204,100 S65.497 plus 32% of the excess over $321,450 $32,743.50 plus 32% of the excess over $160,725 S408,250 S612,350 $204,100 S306,175 $93,257 plus 35% of the excess over S408,250 S46,628.50 plus 35% of the excess over S204,100 S612.350 $306,175 $164.709.50 plus 37% of the excess over S612,350 SS2.354.75 plus 37% of the excess over S306,175 Tax Rates for Net Capital Gains and Qualified Dividends Rate* Taxable Income Single Married Filing Jointly Married Filing Separately Head of Household Trusts and Estates 0% $0 - $78,750 $0 - $39,375 $0 - $39,375 $0 - $52,750 $0 - $2,650 15% $78,751 - $488,850 $39,376 - $244,425 $39,376 - $434,550 $52,751 - $461,700 $2,651 - $12,950 20% $488,851+ $244,426+ $434,551+ $461,701+ $12.951+ *This rate applies to the net capital gains and qualified dividends that fall within the range of taxable income specified in the table (net capital gains and qualified dividends are included in taxable income last for this purpose)