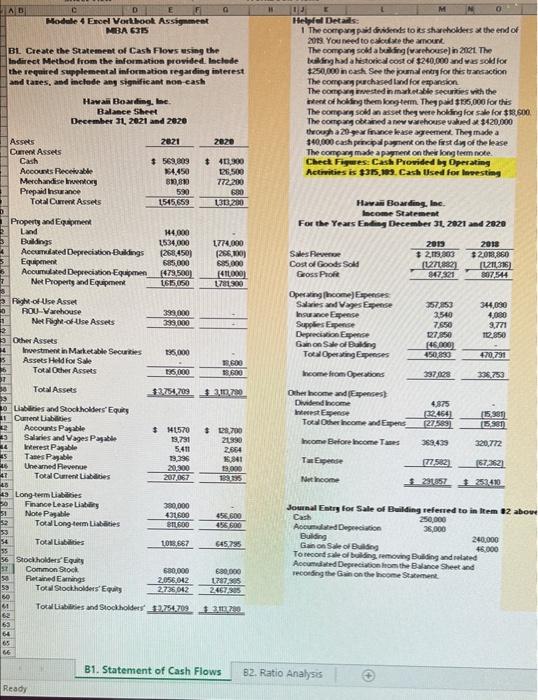
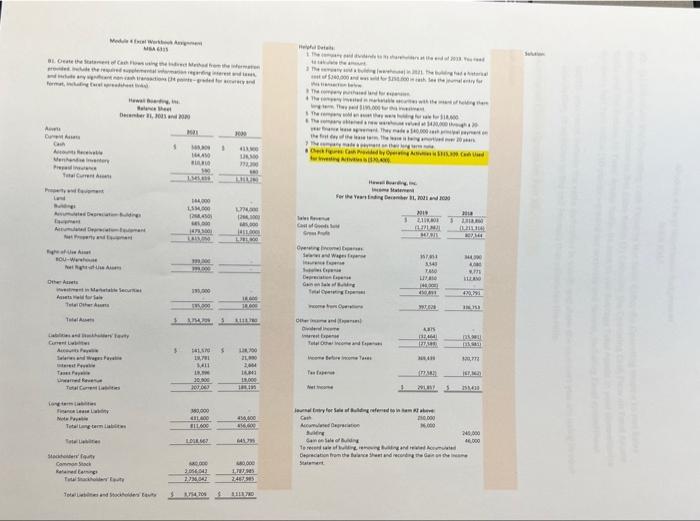
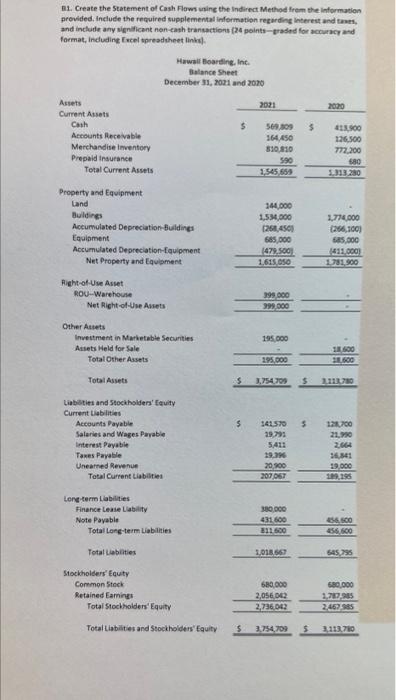
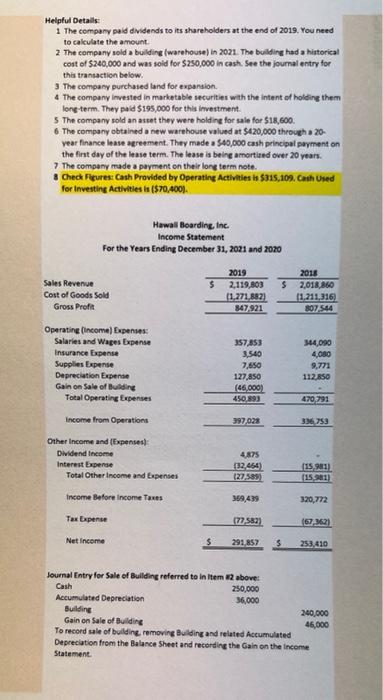
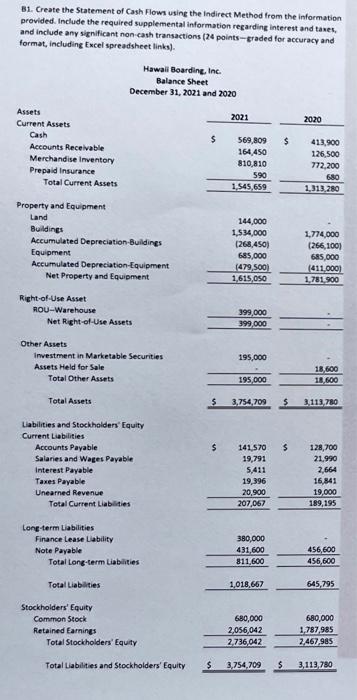
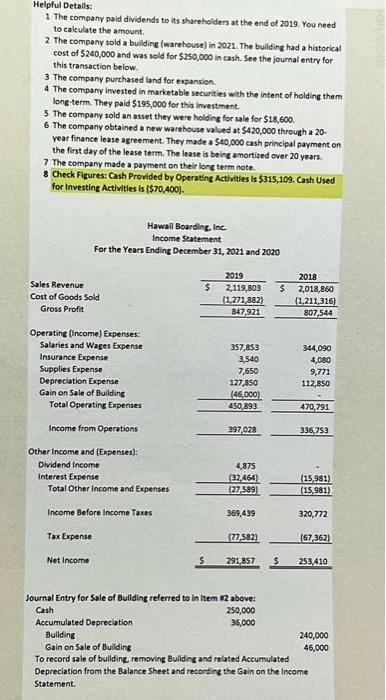
B1 (Photo 1) - Create the statement of cash flows using the indirect method from the information provided. include the required supplemental information regarding interest and taxes, and include any significant non-cash transactions. *check figure provided: cash provided by operating activities is $315,109.
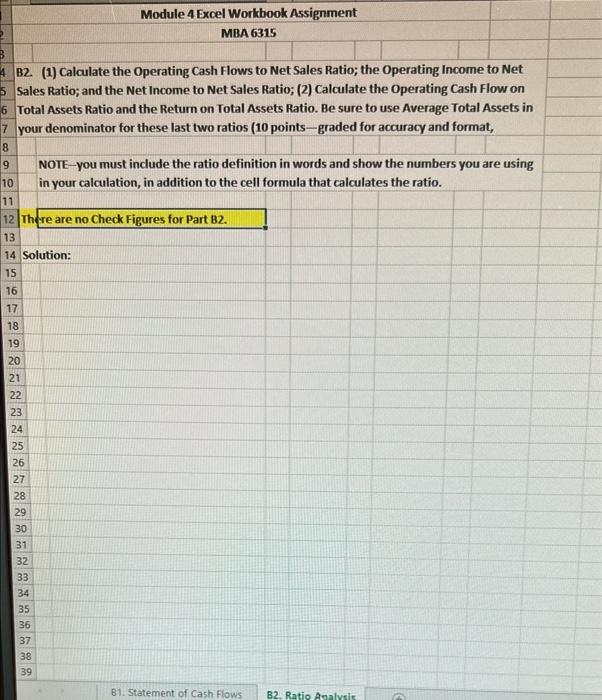
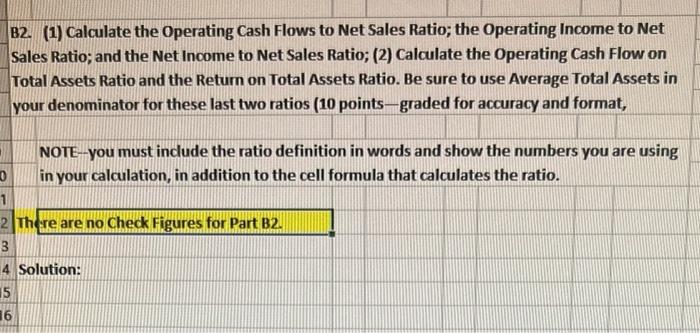
B2 (Photo 2) - (1) Calculate the Operating Cash Flows to Net Sales Ratio; the Operating Income to Net Sales Ratio; and the Net Income to Net Sales Ratio; (2) Calculate the Operating Cash Flow on
Total Assets Ratio and the Return on Total Assets Ratio. Be sure to use Average Total Assets in
your denominator for these last two ratios (10 points- graded for accuracy and format).
*NOTE--you must include the ratio definition in words and show the numbers you are using
in your calculation, in addition to the cell formula that calculates the ratio.
updated with clearer images dor B1.
7 Property and Equipment Land Buildings Accumulated Depreciation Buildings Equipment Accumulated Depreciation Equipmen Net Properts and Equipment Fight-of-Use Asset ROU-Varehouse Net Fight-of-Use Assets Investment in Marketable Securities 5 Assets Held for Sale Total Other Assets Total Assets 0 Liabilities and Stockholders' Equity Current Liabilities 2 Accounts Payable 43 Salaries and Wages Payable Interest Payable Tanes Payable Uneamed Revenue Total Current Liabilities 48 43 Long-term Liables 30 31 32 33 54 AB C D F Module 4 Excel Vorkbook Assignment MBA 6315 BL Create the Statement of Cash Flows using the Indirect Method from the information provided. Include the required supplemental information regarding interest and taxes, and inclode ang significant non-cash Hawaii Boarding, Inc. Balance Sheet December 31, 2021 and 2020 2821 2020 Assets Current Assets Cash Accounts Receivable $ 569,809 164,450 810,810 590 $413,900 126,500 772,200 Merchandise Inventors Prepaid Insurance 690 Total Current Assets 1545,659 1313,200 144,000 1534,000 1774,000 (268,450) (266,100) 685,000 695.000 (479,500) (411,000) 1615,050 1781,900 399,000 399,000 135,000 1,600 18,600 195,000 $3.754,709 1 317.790 $ 141570 $ 129,700 19,791 21,990 2,664 16,941 19,000 103,195 456,600 456,600 645.795 690,000 1,787905 2467.385 3113700 B1. Statement of Cash Flows 82. Ratio Analysis 20 1 3 Other Assets 34 4 45 46 47 55 56 5,411 19,396 20,300 207,067 390,000 431600 Total Long-term Liabilities S1600 Total Liabilities 1018,667 Stockholders Equity Common Stock 600,000 Retained Earnings 2.056,042 Total Stockholders Equity 2736042 Total Liabilities and Stockholders 12.754.709 Finance Lease Liability Note Pagable 52 50 59 60 41 62 64 65 66 Ready G H 1031 E Helpfel Details: 1 The compang paid dividends to its shareholders at the end of 2013 You need to calculate the amount The compang sold a building (warehouse) in 2021. The building had a historical cost of $240,000 and was sold for $250,000 in cash See the journal entry for this transaction The company purchased land for expansion The compang invested in marketable securities with the intent of holding them long-term. They paid $135,000 for this The company sold an asset they were holding for sale for $18,600 The compang obtained a new warehouse valued at $420,000 through a 20-gear finance lease agreement. They made a $40,000 cash principal payment on the first day of the lease The compang made a payment on their long term note. Check Figures: Cash Provided by Operating Activities is $315,199. Cash Used for Investing Hawaii Boarding, Inc. Income Statement For the Years Ending December 31, 2021 and 2020 2019 2018 Sales Reven $ 2,119,803 $2,013,860 Cost of Goods Sold (1271,882) (1211,316) Gross Profit 947,321 807,544 Operating Income) Expenses Salaries and Vages Expense 344,090 Insurance Expense 4,000 3,771 112.850 Supplies Expense Depreciation Expense Gain on Sale of Building Total Operating Expenses 470,791 Income from Operations 336,753 Other Income and (Expenses) Dividend Income Interest Expense 357,853 3,540 7,650 127,850 (46,000) 450,890 397 028 4,875 (32.464) Total Other Income and Expens (27-589) Income Before Income Tanes 369,439 320,772 Tax Expense (77.582) (67,362) Net Income $2918571253410 Journal Entry for Sale of Building referred to in Item #2 above Cash 250,000 Accumulated Depreciation 36,000 Building 240,000 Gain on Sale of Building 46,000 To record sale of building, removing Building and related Accumulated Depreciation from the Balance Sheet and recording the Gain on the Income Statement (15.381) (15,981) Module 4 Excel Workbook Assignment MBA 6315 3 4B2. (1) Calculate the Operating Cash Flows to Net Sales Ratio; the Operating Income to Net 5 Sales Ratio; and the Net Income to Net Sales Ratio; (2) Calculate the Operating Cash Flow on 6 Total Assets Ratio and the Return on Total Assets Ratio. Be sure to use Average Total Assets in 7 your denominator for these last two ratios (10 points-graded for accuracy and format, 8 9 NOTE-you must include the ratio definition in words and show the numbers you are using in your calculation, in addition to the cell formula that calculates the ratio. 10 11 12 There are no Check Figures for Part B2. 13 14 Solution: 15 16 17 18 19 20 21 22 23 24 25 26 27 28 29 30 31 32 33 34 35 36 37 38 39 81. Statement of Cash Flows 82. Ratio Analysis MedleExcel Work MGA G Beate the Statement of Cach Fes using the direct Method from the the required supplemental regarding and and ayant nan cash transactions the pointe-graded for and forming How d December 21, 2023 and 200 DA Can 5 411,00 16,300 772,300 140 1774.000 (200 411.000 L21,800 18000 18,000 Accounts Receivable Menhande entry Pre Total Current A Property m Land Budg A Deprecandings men Actuated De ghaf BOU-W Netge A it in Mal Ass TelOther A Total A Labies and ty Current L Accu Selanda Pat P T Other Ass St PU Total C Long-term Mot s Les Ly Tetal Long-term Lab T Common Stock Rataired Eatings Total Stackholder Total Libes and Stockholders aut Test Ho 144,40 ULIO 140 154540 144,000 1,534,000 (25440) 145,000 47300) 1 TIPS MENT LAILIN 1300 190,000 5.200 $45 $ 141570 S L700 18,791 21,000 2004 16341 30.000 200 043 18,000 184.95 380,000 411400 454,400 $11.000 456,600 LOOK.567 MUS 0,000 80,000 3.056,043 1,787,985 2.736,042 2467585 $1754.7063 8118700 PREVITY H The d GYANAN NG KUMPLET n pu The big we $340,000 and was $250.000 W The company hard and for ex Then markable The $1.000 The new wwing for sale for $1.000 There were ved at $420,000 throug senen They made a 140,000 the f ease the need The p Check Fires ( mat on their long by Operating Active Cas for investing Active H Statemen For the Year Ending December 31, 2021 and 100 2019 time Cash Accumulated Depreciat 2013 bung hand lry for with the end of holding the Castof G Operating come Sand Wages Exp Exp C Deprecate Gaining Total Operating Exp Operat Other and D mrest Expense Total Other mand N Entry for Sale af Building referred to in 210.000 1.000 Sur Gaon Sale of Building To red sale of building, enging and read Acumu Depreciation from the balance sheet and recording the Ganon d Stat TO? E Trw ZEET ARVON T 157851 3343 7850 L 144.000 SAVOLE 790,000 SURY (32464) 1273 HUAR WIDE STARTA (1214) 307344 3440 400 www. ILZANO 470,9 ESOME (28.901) (151) 120,772 DA 240,000 44,000 B1. Create the Statement of Cash Flows using the Indirect Method from the information provided. Include the required supplemental information regarding interest and taxes, and include any significant non-cash transactions (24 points-graded for accuracy and format, including Excel spreadsheet links). Hawall Boarding, Inc. Balance Sheet December 31, 2021 and 2020 Assets 2020 Current Assets Cash S Accounts Receivable Merchandise Inventory Prepaid Insurance Total Current Assets Property and Equipment Land Buildings Accumulated Depreciation-Buildings Equipment Accumulated Depreciation Equipment Net Property and Equipment Right-of-Use Asset Net Right-of-Use Assets Investment in Marketable Securities Assets Held for Sale Total Other Assets Total Assets Liabilities and Stockholders' Equity Current Liabilities Accounts Payable Salaries and Wages Payable Interest Payable Taxes Payable Unearned Revenue Total Current Liabilities ROU-Warehouse Other Assets Long-term Liabilities Finance Lease Liability Note Payable Total Long-term Liabilities Total Liabilities Total Stockholders' Equity Total Liabilities and Stockholders' Equity Stockholders' Equity Common Stock Retained Earnings 2021 569,309 164,450 810,810 590 1,545,659 144,000 1,534,000 (268,450) 685,000 (479,500 1,615,050 399,000 999,000 195,000 195,000 $ 3,754,709 $ $ 141,570 $ 19,791 5,411 19,396 20,900 207,067 380,000 431,600 811.600 1,018.667 680,000 2,056,042 2,736,042 3.754,709 $ $ 413,900 126,500 772,200 680 1,313,280 1,774,000 (266,100) 685,000 (411,000) 1.781,900 18,600 18,600 3.113,780 128,700 21,990 2,664 16,841 19,000 189,195 456,500 456,600 645,795 680,000 1,787,985 2,467,985 $ 3,113,780 Helpful Details: 1 The company paid dividends to its shareholders at the end of 2019. You need to calculate the amount. 2 The company sold a building (warehouse) in 2021. The building had a historical cost of $240,000 and was sold for $250,000 in cash. See the journal entry for this transaction below. 3 The company purchased land for expansion. 4 The company invested in marketable securities with the intent of holding them long-term. They paid $195,000 for this investment 5 The company sold an asset they were holding for sale for $18,600. 6 The company obtained a new warehouse valued at $420,000 through a 20- year finance lease agreement. They made a $40,000 cash principal payment on the first day of the lease term. The lease is being amortized over 20 years. 7 The company made a payment on their long term note. 8 Check Figures: Cash Provided by Operating Activities is $315,109. Cash Used for Investing Activities is ($70,400). Hawall Boarding, Inc. Income Statement For the Years Ending December 31, 2021 and 2020 2019 2018 $ 2,119,803 $ 2,018,860 (1,271,882) 847,921 (1.211,316) 807,544 357,853 344,090 3,540 4,080 7,650 9,771 127,850 112,850 (46,000) Total Operating Expenses 450,893 470,791 Income from Operations 397,028 336,753 Other Income and (Expenses) Dividend Income 4,875 Interest Expense (32,464) (15,981) Total Other Income and Expenses (27,589) (15,981) Income Before Income Taxes 369,439 320,772 Tax Expense (77.582) (67,362) Net Income $ 291,857 253,410 Journal Entry for Sale of Building referred to in Item #2 above: Cash 250,000 Accumulated Depreciation 36,000 Building 240,000 Gain on Sale of Building 46,000 To record sale of building, removing Building and related Accumulated Depreciation from the Balance Sheet and recording the Gain on the income Statement. Sales Revenue Cost of Goods Sold Gross Profit Operating (Income) Expenses: Salaries and Wages Expense Insurance Expense Supplies Expense Depreciation Expense Gain on Sale of Building S 81. Create the Statement of Cash Flows using the Indirect Method from the information provided. Include the required supplemental information regarding interest and taxes, and include any significant non-cash transactions (24 points-graded for accuracy and format, including Excel spreadsheet links). Hawaii Boarding, Inc. Balance Sheet December 31, 2021 and 2020 2021 2020 Assets Current Assets Cash $ Accounts Receivable Merchandise Inventory Prepaid Insurance Total Current Assets Property and Equipment Land Buildings Accumulated Depreciation-Buildings Equipment Accumulated Depreciation-Equipment Net Property and Equipment Right-of-Use Asset Net Right-of-Use Assets Other Assets Investment in Marketable Securities Assets Held for Sale Total Other Assets Total Assets Liabilities and Stockholders Equity Current Liabilities Accounts Payable Salaries and Wages Payable Interest Payable Taxes Payable Unearned Revenue Total Current Liabilities ROU-Warehouse Long-term Liabilities Finance Lease Liability Note Payable Total Long-term Liabilities Total Liabilities Stockholders' Equity Common Stock Retained Earnings Total Stockholders' Equity Total Liabilities and Stockholders' Equity 569,809 $ 164,450 810,810 590 1,545,659 144,000 1,534,000 (268,450) 685,000 (479,500) 1,615,050 399,000 399,000 195,000 195,000 $ 3,754,709 $ 141,570 19,791 5,411 19,396 20,900 207,067 380,000 431,600 811,600 1,018,667 680,000 2,056,042 2,736,042 3,754,709 $ 413,900 126,500 772,200 680 1,313,280 1,774,000 (266,100) 685,000 (411,000) 1,781,900 18.600 18,600 3,113,780 128,700 21,990 2,664 16,841 19,000 189,195 456,600 456,600 645,795 680,000 1,787,985 2,467,985 $ 3,113,780 $ $ Helpful Details: 1 The company paid dividends to its shareholders at the end of 2019. You need to calculate the amount. 2 The company sold a building (warehouse) in 2021. The building had a historical cost of $240,000 and was sold for $250,000 in cash. See the journal entry for this transaction below. 3 The company purchased land for expansion. 4 The company invested in marketable securities with the intent of holding them long-term. They paid $195,000 for this investment. 5 The company sold an asset they were holding for sale for $18,600. 6 The company obtained a new warehouse valued at $420,000 through a 20- year finance lease agreement. They made a $40,000 cash principal payment on the first day of the lease term. The lease is being amortized over 20 years. 7 The company made a payment on their long term note. 8 Check Figures: Cash Provided by Operating Activities is $315,109. Cash Used for Investing Activities is ($70,400). Hawall Boarding, Inc. Income Statement For the Years Ending December 31, 2021 and 2020 2019 2018 $ 2,119,803 $ 2,018,860 (1,271,882) (1,211,316) 807,544 847,921 357,853 344,090 3,540 4,080 7,650 9,771 127,850 112,850 (46,000) Total Operating Expenses 450,893 470,791 Income from Operations 397,028 336,753 Other Income and (Expenses): Dividend Income 4,875 Interest Expense (32,464) (15,981) Total Other Income and Expenses (27,589) (15,981) Income Before Income Taxes 369,439 320,772 Tax Expense (77,582) (67,362) Net Income 291,857 $ 253,410 Journal Entry for Sale of Building referred to in Item #2 above: Cash 250,000 Accumulated Depreciation 36,000 Building 240,000 Gain on Sale of Building 46,000 To record sale of building, removing Building and related Accumulated Depreciation from the Balance Sheet and recording the Gain on the Income Statement. Sales Revenue Cost of Goods Sold Gross Profit Operating (Income) Expenses: Salaries and Wages Expense Insurance Expense Supplies Expense Depreciation Expense Gain on Sale of Building B2. (1) Calculate the Operating Cash Flows to Net Sales Ratio; the Operating Income to Net Sales Ratio; and the Net Income to Net Sales Ratio; (2) Calculate the Operating Cash Flow on Total Assets Ratio and the Return on Total Assets Ratio. Be sure to use Average Total Assets in your denominator for these last two ratios (10 points-graded for accuracy and format, NOTE--you must include the ratio definition in words and show the numbers you are using in your calculation, in addition to the cell formula that calculates the ratio. 0 1 2 There are no Check Figures for Part B2. 3 4 Solution: 456 7 Property and Equipment Land Buildings Accumulated Depreciation Buildings Equipment Accumulated Depreciation Equipmen Net Properts and Equipment Fight-of-Use Asset ROU-Varehouse Net Fight-of-Use Assets Investment in Marketable Securities 5 Assets Held for Sale Total Other Assets Total Assets 0 Liabilities and Stockholders' Equity Current Liabilities 2 Accounts Payable 43 Salaries and Wages Payable Interest Payable Tanes Payable Uneamed Revenue Total Current Liabilities 48 43 Long-term Liables 30 31 32 33 54 AB C D F Module 4 Excel Vorkbook Assignment MBA 6315 BL Create the Statement of Cash Flows using the Indirect Method from the information provided. Include the required supplemental information regarding interest and taxes, and inclode ang significant non-cash Hawaii Boarding, Inc. Balance Sheet December 31, 2021 and 2020 2821 2020 Assets Current Assets Cash Accounts Receivable $ 569,809 164,450 810,810 590 $413,900 126,500 772,200 Merchandise Inventors Prepaid Insurance 690 Total Current Assets 1545,659 1313,200 144,000 1534,000 1774,000 (268,450) (266,100) 685,000 695.000 (479,500) (411,000) 1615,050 1781,900 399,000 399,000 135,000 1,600 18,600 195,000 $3.754,709 1 317.790 $ 141570 $ 129,700 19,791 21,990 2,664 16,941 19,000 103,195 456,600 456,600 645.795 690,000 1,787905 2467.385 3113700 B1. Statement of Cash Flows 82. Ratio Analysis 20 1 3 Other Assets 34 4 45 46 47 55 56 5,411 19,396 20,300 207,067 390,000 431600 Total Long-term Liabilities S1600 Total Liabilities 1018,667 Stockholders Equity Common Stock 600,000 Retained Earnings 2.056,042 Total Stockholders Equity 2736042 Total Liabilities and Stockholders 12.754.709 Finance Lease Liability Note Pagable 52 50 59 60 41 62 64 65 66 Ready G H 1031 E Helpfel Details: 1 The compang paid dividends to its shareholders at the end of 2013 You need to calculate the amount The compang sold a building (warehouse) in 2021. The building had a historical cost of $240,000 and was sold for $250,000 in cash See the journal entry for this transaction The company purchased land for expansion The compang invested in marketable securities with the intent of holding them long-term. They paid $135,000 for this The company sold an asset they were holding for sale for $18,600 The compang obtained a new warehouse valued at $420,000 through a 20-gear finance lease agreement. They made a $40,000 cash principal payment on the first day of the lease The compang made a payment on their long term note. Check Figures: Cash Provided by Operating Activities is $315,199. Cash Used for Investing Hawaii Boarding, Inc. Income Statement For the Years Ending December 31, 2021 and 2020 2019 2018 Sales Reven $ 2,119,803 $2,013,860 Cost of Goods Sold (1271,882) (1211,316) Gross Profit 947,321 807,544 Operating Income) Expenses Salaries and Vages Expense 344,090 Insurance Expense 4,000 3,771 112.850 Supplies Expense Depreciation Expense Gain on Sale of Building Total Operating Expenses 470,791 Income from Operations 336,753 Other Income and (Expenses) Dividend Income Interest Expense 357,853 3,540 7,650 127,850 (46,000) 450,890 397 028 4,875 (32.464) Total Other Income and Expens (27-589) Income Before Income Tanes 369,439 320,772 Tax Expense (77.582) (67,362) Net Income $2918571253410 Journal Entry for Sale of Building referred to in Item #2 above Cash 250,000 Accumulated Depreciation 36,000 Building 240,000 Gain on Sale of Building 46,000 To record sale of building, removing Building and related Accumulated Depreciation from the Balance Sheet and recording the Gain on the Income Statement (15.381) (15,981) Module 4 Excel Workbook Assignment MBA 6315 3 4B2. (1) Calculate the Operating Cash Flows to Net Sales Ratio; the Operating Income to Net 5 Sales Ratio; and the Net Income to Net Sales Ratio; (2) Calculate the Operating Cash Flow on 6 Total Assets Ratio and the Return on Total Assets Ratio. Be sure to use Average Total Assets in 7 your denominator for these last two ratios (10 points-graded for accuracy and format, 8 9 NOTE-you must include the ratio definition in words and show the numbers you are using in your calculation, in addition to the cell formula that calculates the ratio. 10 11 12 There are no Check Figures for Part B2. 13 14 Solution: 15 16 17 18 19 20 21 22 23 24 25 26 27 28 29 30 31 32 33 34 35 36 37 38 39 81. Statement of Cash Flows 82. Ratio Analysis MedleExcel Work MGA G Beate the Statement of Cach Fes using the direct Method from the the required supplemental regarding and and ayant nan cash transactions the pointe-graded for and forming How d December 21, 2023 and 200 DA Can 5 411,00 16,300 772,300 140 1774.000 (200 411.000 L21,800 18000 18,000 Accounts Receivable Menhande entry Pre Total Current A Property m Land Budg A Deprecandings men Actuated De ghaf BOU-W Netge A it in Mal Ass TelOther A Total A Labies and ty Current L Accu Selanda Pat P T Other Ass St PU Total C Long-term Mot s Les Ly Tetal Long-term Lab T Common Stock Rataired Eatings Total Stackholder Total Libes and Stockholders aut Test Ho 144,40 ULIO 140 154540 144,000 1,534,000 (25440) 145,000 47300) 1 TIPS MENT LAILIN 1300 190,000 5.200 $45 $ 141570 S L700 18,791 21,000 2004 16341 30.000 200 043 18,000 184.95 380,000 411400 454,400 $11.000 456,600 LOOK.567 MUS 0,000 80,000 3.056,043 1,787,985 2.736,042 2467585 $1754.7063 8118700 PREVITY H The d GYANAN NG KUMPLET n pu The big we $340,000 and was $250.000 W The company hard and for ex Then markable The $1.000 The new wwing for sale for $1.000 There were ved at $420,000 throug senen They made a 140,000 the f ease the need The p Check Fires ( mat on their long by Operating Active Cas for investing Active H Statemen For the Year Ending December 31, 2021 and 100 2019 time Cash Accumulated Depreciat 2013 bung hand lry for with the end of holding the Castof G Operating come Sand Wages Exp Exp C Deprecate Gaining Total Operating Exp Operat Other and D mrest Expense Total Other mand N Entry for Sale af Building referred to in 210.000 1.000 Sur Gaon Sale of Building To red sale of building, enging and read Acumu Depreciation from the balance sheet and recording the Ganon d Stat TO? E Trw ZEET ARVON T 157851 3343 7850 L 144.000 SAVOLE 790,000 SURY (32464) 1273 HUAR WIDE STARTA (1214) 307344 3440 400 www. ILZANO 470,9 ESOME (28.901) (151) 120,772 DA 240,000 44,000 B1. Create the Statement of Cash Flows using the Indirect Method from the information provided. Include the required supplemental information regarding interest and taxes, and include any significant non-cash transactions (24 points-graded for accuracy and format, including Excel spreadsheet links). Hawall Boarding, Inc. Balance Sheet December 31, 2021 and 2020 Assets 2020 Current Assets Cash S Accounts Receivable Merchandise Inventory Prepaid Insurance Total Current Assets Property and Equipment Land Buildings Accumulated Depreciation-Buildings Equipment Accumulated Depreciation Equipment Net Property and Equipment Right-of-Use Asset Net Right-of-Use Assets Investment in Marketable Securities Assets Held for Sale Total Other Assets Total Assets Liabilities and Stockholders' Equity Current Liabilities Accounts Payable Salaries and Wages Payable Interest Payable Taxes Payable Unearned Revenue Total Current Liabilities ROU-Warehouse Other Assets Long-term Liabilities Finance Lease Liability Note Payable Total Long-term Liabilities Total Liabilities Total Stockholders' Equity Total Liabilities and Stockholders' Equity Stockholders' Equity Common Stock Retained Earnings 2021 569,309 164,450 810,810 590 1,545,659 144,000 1,534,000 (268,450) 685,000 (479,500 1,615,050 399,000 999,000 195,000 195,000 $ 3,754,709 $ $ 141,570 $ 19,791 5,411 19,396 20,900 207,067 380,000 431,600 811.600 1,018.667 680,000 2,056,042 2,736,042 3.754,709 $ $ 413,900 126,500 772,200 680 1,313,280 1,774,000 (266,100) 685,000 (411,000) 1.781,900 18,600 18,600 3.113,780 128,700 21,990 2,664 16,841 19,000 189,195 456,500 456,600 645,795 680,000 1,787,985 2,467,985 $ 3,113,780 Helpful Details: 1 The company paid dividends to its shareholders at the end of 2019. You need to calculate the amount. 2 The company sold a building (warehouse) in 2021. The building had a historical cost of $240,000 and was sold for $250,000 in cash. See the journal entry for this transaction below. 3 The company purchased land for expansion. 4 The company invested in marketable securities with the intent of holding them long-term. They paid $195,000 for this investment 5 The company sold an asset they were holding for sale for $18,600. 6 The company obtained a new warehouse valued at $420,000 through a 20- year finance lease agreement. They made a $40,000 cash principal payment on the first day of the lease term. The lease is being amortized over 20 years. 7 The company made a payment on their long term note. 8 Check Figures: Cash Provided by Operating Activities is $315,109. Cash Used for Investing Activities is ($70,400). Hawall Boarding, Inc. Income Statement For the Years Ending December 31, 2021 and 2020 2019 2018 $ 2,119,803 $ 2,018,860 (1,271,882) 847,921 (1.211,316) 807,544 357,853 344,090 3,540 4,080 7,650 9,771 127,850 112,850 (46,000) Total Operating Expenses 450,893 470,791 Income from Operations 397,028 336,753 Other Income and (Expenses) Dividend Income 4,875 Interest Expense (32,464) (15,981) Total Other Income and Expenses (27,589) (15,981) Income Before Income Taxes 369,439 320,772 Tax Expense (77.582) (67,362) Net Income $ 291,857 253,410 Journal Entry for Sale of Building referred to in Item #2 above: Cash 250,000 Accumulated Depreciation 36,000 Building 240,000 Gain on Sale of Building 46,000 To record sale of building, removing Building and related Accumulated Depreciation from the Balance Sheet and recording the Gain on the income Statement. Sales Revenue Cost of Goods Sold Gross Profit Operating (Income) Expenses: Salaries and Wages Expense Insurance Expense Supplies Expense Depreciation Expense Gain on Sale of Building S 81. Create the Statement of Cash Flows using the Indirect Method from the information provided. Include the required supplemental information regarding interest and taxes, and include any significant non-cash transactions (24 points-graded for accuracy and format, including Excel spreadsheet links). Hawaii Boarding, Inc. Balance Sheet December 31, 2021 and 2020 2021 2020 Assets Current Assets Cash $ Accounts Receivable Merchandise Inventory Prepaid Insurance Total Current Assets Property and Equipment Land Buildings Accumulated Depreciation-Buildings Equipment Accumulated Depreciation-Equipment Net Property and Equipment Right-of-Use Asset Net Right-of-Use Assets Other Assets Investment in Marketable Securities Assets Held for Sale Total Other Assets Total Assets Liabilities and Stockholders Equity Current Liabilities Accounts Payable Salaries and Wages Payable Interest Payable Taxes Payable Unearned Revenue Total Current Liabilities ROU-Warehouse Long-term Liabilities Finance Lease Liability Note Payable Total Long-term Liabilities Total Liabilities Stockholders' Equity Common Stock Retained Earnings Total Stockholders' Equity Total Liabilities and Stockholders' Equity 569,809 $ 164,450 810,810 590 1,545,659 144,000 1,534,000 (268,450) 685,000 (479,500) 1,615,050 399,000 399,000 195,000 195,000 $ 3,754,709 $ 141,570 19,791 5,411 19,396 20,900 207,067 380,000 431,600 811,600 1,018,667 680,000 2,056,042 2,736,042 3,754,709 $ 413,900 126,500 772,200 680 1,313,280 1,774,000 (266,100) 685,000 (411,000) 1,781,900 18.600 18,600 3,113,780 128,700 21,990 2,664 16,841 19,000 189,195 456,600 456,600 645,795 680,000 1,787,985 2,467,985 $ 3,113,780 $ $ Helpful Details: 1 The company paid dividends to its shareholders at the end of 2019. You need to calculate the amount. 2 The company sold a building (warehouse) in 2021. The building had a historical cost of $240,000 and was sold for $250,000 in cash. See the journal entry for this transaction below. 3 The company purchased land for expansion. 4 The company invested in marketable securities with the intent of holding them long-term. They paid $195,000 for this investment. 5 The company sold an asset they were holding for sale for $18,600. 6 The company obtained a new warehouse valued at $420,000 through a 20- year finance lease agreement. They made a $40,000 cash principal payment on the first day of the lease term. The lease is being amortized over 20 years. 7 The company made a payment on their long term note. 8 Check Figures: Cash Provided by Operating Activities is $315,109. Cash Used for Investing Activities is ($70,400). Hawall Boarding, Inc. Income Statement For the Years Ending December 31, 2021 and 2020 2019 2018 $ 2,119,803 $ 2,018,860 (1,271,882) (1,211,316) 807,544 847,921 357,853 344,090 3,540 4,080 7,650 9,771 127,850 112,850 (46,000) Total Operating Expenses 450,893 470,791 Income from Operations 397,028 336,753 Other Income and (Expenses): Dividend Income 4,875 Interest Expense (32,464) (15,981) Total Other Income and Expenses (27,589) (15,981) Income Before Income Taxes 369,439 320,772 Tax Expense (77,582) (67,362) Net Income 291,857 $ 253,410 Journal Entry for Sale of Building referred to in Item #2 above: Cash 250,000 Accumulated Depreciation 36,000 Building 240,000 Gain on Sale of Building 46,000 To record sale of building, removing Building and related Accumulated Depreciation from the Balance Sheet and recording the Gain on the Income Statement. Sales Revenue Cost of Goods Sold Gross Profit Operating (Income) Expenses: Salaries and Wages Expense Insurance Expense Supplies Expense Depreciation Expense Gain on Sale of Building B2. (1) Calculate the Operating Cash Flows to Net Sales Ratio; the Operating Income to Net Sales Ratio; and the Net Income to Net Sales Ratio; (2) Calculate the Operating Cash Flow on Total Assets Ratio and the Return on Total Assets Ratio. Be sure to use Average Total Assets in your denominator for these last two ratios (10 points-graded for accuracy and format, NOTE--you must include the ratio definition in words and show the numbers you are using in your calculation, in addition to the cell formula that calculates the ratio. 0 1 2 There are no Check Figures for Part B2. 3 4 Solution: 456