Answered step by step
Verified Expert Solution
Question
1 Approved Answer
b123 update B.) Using Insight Maker, recreate the cane toad logistic growth model that you built by hand HW#1 : Create a model for the
b123 

update
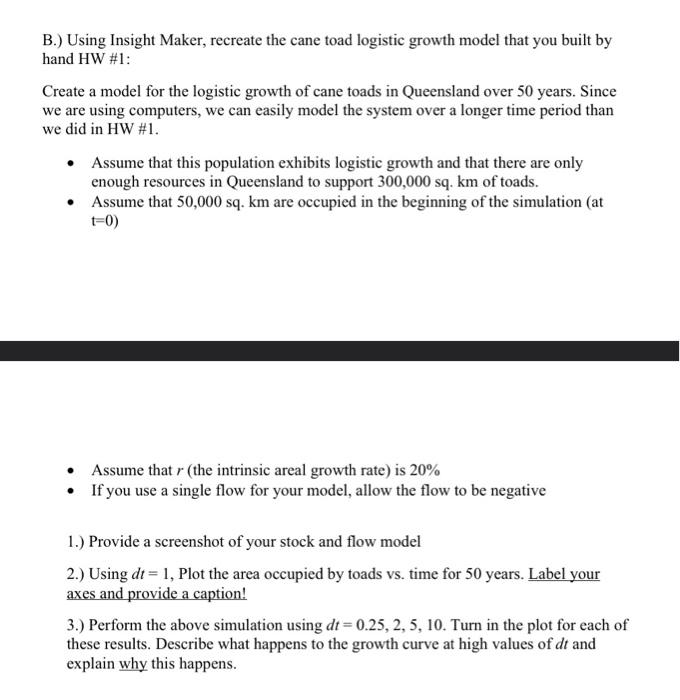
B.) Using Insight Maker, recreate the cane toad logistic growth model that you built by hand HW#1 : Create a model for the logistic growth of cane toads in Queensland over 50 years. Since we are using computers, we can easily model the system over a longer time period than we did in HW #1. - Assume that this population exhibits logistic growth and that there are only enough resources in Queensland to support 300,000sq. km of toads. - Assume that 50,000 sq. km are occupied in the beginning of the simulation (at t=0) - Assume that r (the intrinsic areal growth rate) is 20% - If you use a single flow for your model, allow the flow to be negative 1.) Provide a screenshot of your stock and flow model 2.) Using dt=1, Plot the area occupied by toads vs. time for 50 years. Label your axes and provide a caption! 3.) Perform the above simulation using dt=0.25,2,5,10. Turn in the plot for each of these results. Describe what happens to the growth curve at high values of dt and explain why this happens. B.) Using Insight Maker, recreate the cane toad logistic growth model that you built by hand HW#1 : Create a model for the logistic growth of cane toads in Queensland over 50 years. Since we are using computers, we can easily model the system over a longer time period than we did in HW #1. - Assume that this population exhibits logistic growth and that there are only enough resources in Queensland to support 300,000sq. km of toads. - Assume that 50,000 sq. km are occupied in the beginning of the simulation (at t=0) - Assume that r (the intrinsic areal growth rate) is 20% - If you use a single flow for your model, allow the flow to be negative 1.) Provide a screenshot of your stock and flow model 2.) Using dt=1, Plot the area occupied by toads vs. time for 50 years. Label your axes and provide a caption! 3.) Perform the above simulation using dt=0.25,2,5,10. Turn in the plot for each of these results. Describe what happens to the growth curve at high values of dt and explain why this happens Step by Step Solution
There are 3 Steps involved in it
Step: 1

Get Instant Access to Expert-Tailored Solutions
See step-by-step solutions with expert insights and AI powered tools for academic success
Step: 2

Step: 3

Ace Your Homework with AI
Get the answers you need in no time with our AI-driven, step-by-step assistance
Get Started


