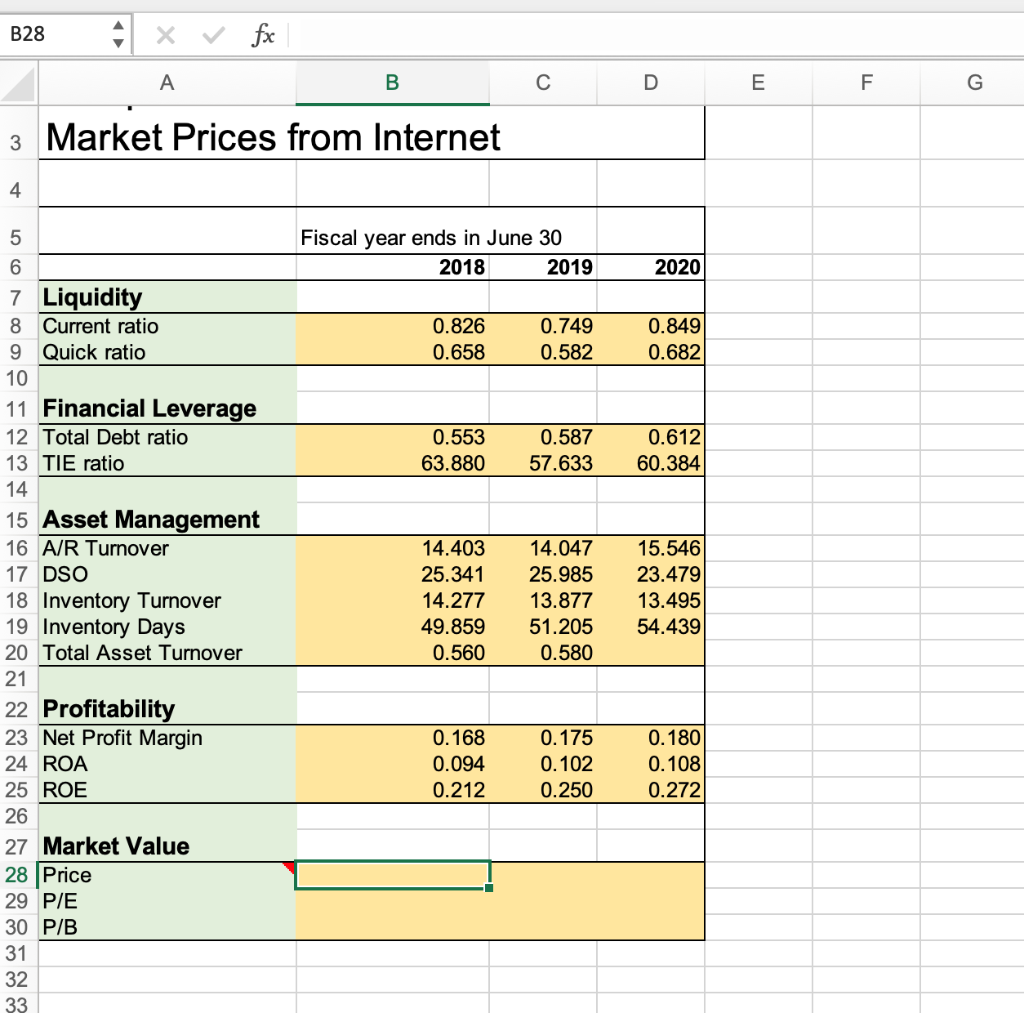
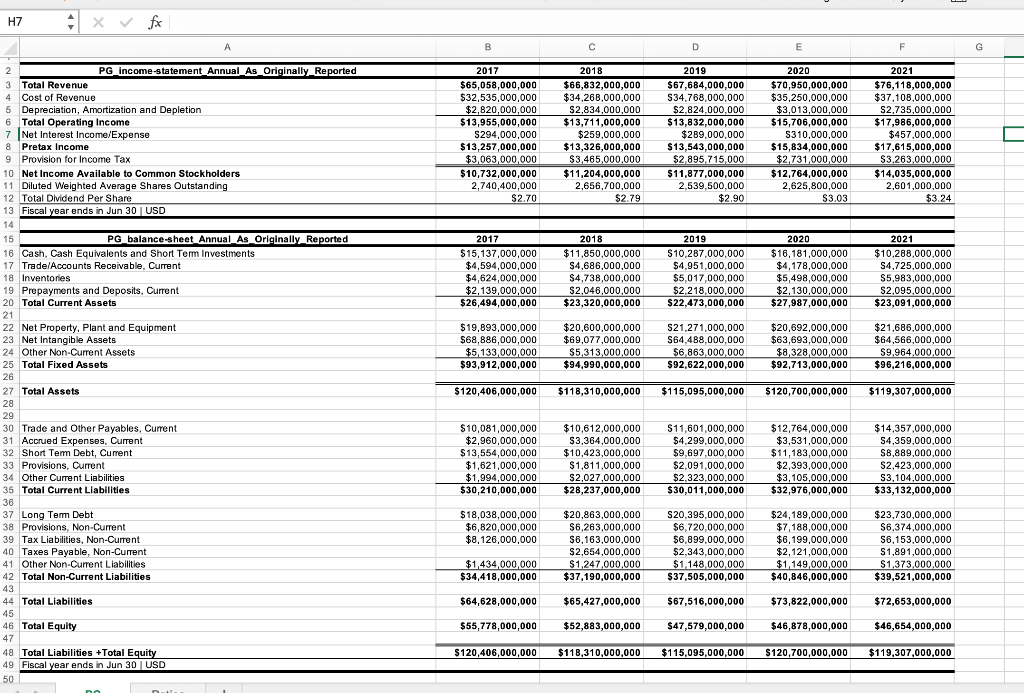
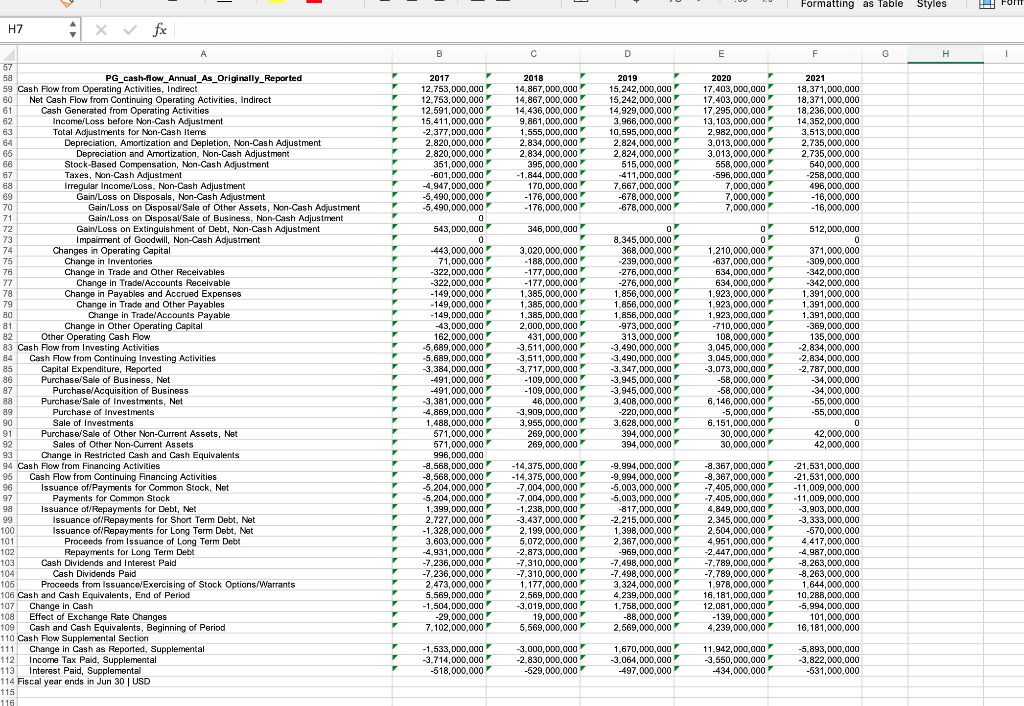
B28 fx A B 3 Market Prices from Internet 4 5 6 7 Liquidity 8 Current ratio 9 Quick ratio 10 11 Financial Leverage 12 Total Debt ratio 13 TIE ratio 14 15 Asset Management 16 A/R Turnover 17 DSO 18 Inventory Turnover 19 Inventory Days 20 Total Asset Turnover 21 22 Profitability 23 Net Profit Margin 24 ROA 25 ROE 26 27 Market Value 28 Price 29 P/E 30 P/B 31 32 33 D Fiscal year ends in June 30 2018 2019 2020 0.826 0.749 0.849 0.658 0.582 0.682 0.553 0.587 0.612 63.880 57.633 60.384 14.403 14.047 15.546 25.341 25.985 23.479 14.277 13.877 13.495 49.859 51.205 54.439 0.560 0.580 0.168 0.175 0.180 0.094 0.102 0.108 0.212 0.250 0.272 E F G H7 x fx A PG income-statement_Annual_As_Originally_ Reported PG_balance-sheet_Annual_As_Originally Reported 2 3 Total Revenue 4 Cost of Revenue 5 Depreciation, Amortization and Depletion 6 Total Operating Income 7 Net Interest Income/Expense 8 Pretax Income 9 Provision for Income Tax 10 Net Income Available to Common Stockholders 11 Diluted Weighted Average Shares Outstanding 12 Total Dividend Per Share 13 Fiscal year ends in Jun 30 | USD 14 15 16 Cash, Cash Equivalents and Short Term Investments 17 Trade/Accounts Receivable, Current 18 Inventories 19 Prepayments and Deposits, Current 20 Total Current Assets 21 22 Net Property, Plant and Equipment 23 Net Intangible Assets 24 Other Non-Current Assets 25 Total Fixed Assets 26 27 Total Assets 28 29 30 Trade and Other Payables, Current 31 Accrued Expenses, Current 32 Short Term Debt, Current 33 Provisions, Current 34 Other Current Liabilities 35 Total Current Liabilities 36 37 Long Term Debt 38 Provisions, Non-Current 39 Tax Liabilities. Non-Current 40 Taxes Payable, Non-Current 41 Other Non-Current Liabilities 42 Total Non-Current Liabilities 43 44 Total Liabilities 45 46 Total Equity 47 48 Total Liabilities +Total Equity 49 Fiscal year ends in Jun 30 | USD 50 Dali B C D E F 2017 2019 2021 2018 $66,832,000,000 $67,684,000,000 2020 $70,950,000,000 $76,118,000,000 $65,058,000,000 $32,535,000,000 $34,268,000,000 $34,768,000,000 $35,250,000,000 $37,108,000,000 $3,013,000,000 $2,735,000,000 $2,820,000,000 $13,955,000,000 $15,706,000,000 $17,986,000,000 $310,000,000 $457,000,000 $2,834,000,000 $2,824,000,000 $13,711,000,000 $13,832,000,000 $294,000,000 $259,000,000 $289,000,000 $13,257,000,000 $13,326,000,000 $13,543,000,000 $15,834,000,000 $17,615,000,000 $3,063,000,000 $3,465,000,000 $10,732,000,000 $11,204,000,000 2,740,400,000 2,656,700,000 $3,263,000,000 $2,895,715,000 $2,731,000,000 $11,877,000,000 $12,764,000,000 2,539,500,000 2,625,800,000 $3.03 $14,035,000,000 2,601,000,000 $3.24 $2.70 $2.79 $2.90 2018 $11,850,000,000 $4,686,000,000 2019 $10,287,000,000 $4,951,000,000 2020 $16,181,000,000 $4,178,000,000 2017 $15,137,000,000 $4,594,000,000 $4,624,000,000 $2,139,000,000 $26,494,000,000 $23,320,000,000 $22,473,000,000 $27,987,000,000 2021 $10,288,000,000 $4,725,000,000 $5,983,000,000 $2,095,000,000 $5,017,000,000 $5,498,000,000 $4,738,000,000 $2,046,000,000 $2,218,000,000 $2,130,000,000 $23,091,000,000 $21,686,000,000 $64,566,000,000 $19,893,000,000 $20,600,000,000 $21,271,000,000 $20,692,000,000 $68,886,000,000 $69,077,000,000 $64,488,000,000 $63,693,000,000 $5,133,000,000 $5,313,000,000 $6,863,000,000 $93,912,000,000 $94,990,000,000 $92,622,000,000 $8,328,000,000 $9.964,000,000 $92,713,000,000 $96,216,000,000 $120,406,000,000 $118,310,000,000 $115,095,000,000 $120,700,000,000 $119,307,000,000 $14,357,000,000 $10,081,000,000 $10,612,000,000 $11,601,000,000 $12,764,000,000 $2,960,000,000 $4,299,000,000 $3,531,000,000 $4,359,000,000 $3,364,000,000 $13,554,000,000 $10,423,000,000 $9,697,000,000 $11,183,000,000 $8,889,000,000 $1,621,000,000 $1,811,000,000 $2,091,000,000 $2,393,000,000 $2,423,000,000 $1,994,000,000 $2,027,000,000 $2,323,000,000 $3,105,000,000 $3,104,000,000 $30,210,000,000 $28,237,000,000 $30,011,000,000 $32,976,000,000 $33,132,000,000 $18,038,000,000 $20,863,000,000 $20,395,000,000 $24,189,000,000 $23,730,000,000 $6,820,000,000 $6,263,000,000 $6,720,000,000 $7,188,000,000 $6,374,000,000 $8,126,000,000 $6,163,000,000 $6,899,000,000 $6,199,000,000 S6,153,000,000 $2,654,000,000 $2,343,000,000 $2,121,000,000 $1,891,000,000 $1,373,000,000 $1,434,000,000 $1,247,000,000 $1,148,000,000 $1,149,000,000 $34,418,000,000 $37,190,000,000 $37,505,000,000 $40,846,000,000 $39,521,000,000 $64,628,000,000 $65,427,000,000 $67,516,000,000 $73,822,000,000 $72,653,000,000 $55,778,000,000 $52,883,000,000 $47,579,000,000 $46,878,000,000 $46,654,000,000 $120,406,000,000 $118,310,000,000 $115,095,000,000 $120,700,000,000 $119,307,000,000 G x fx A 57 58 PG_cash-flow_Annual_As_Originally_Reported 59 Cash Flow from Operating Activities, Indirect 60 Net Cash Flow from Continuing Operating Activities, Indirect 61 Cash Generated from Operating Activities 62 Income/Loss before Non-Cash Adjustment 63 Total Adjustments for Non-Cash Items 64 Depreciation, Amortization and Depletion, Non-Cash Adjustment Depreciation and Amortization, Non-Cash Adjustment 65 66 Stock-Based Compensation, Non-Cash Adjustment 67 Taxes, Non-Cash Adjustment 68 Irregular Income/Loss, Non-Cash Adjustment 69 Gain/Loss on Disposals, Non-Cash Adjustment 70 71 72 Gain/Loss on Disposal/Sale of Other Assets, Non-Cash Adjustment Gain/Loss on Disposal/Sale of Business, Non-Cash Adjustment Gain/Loss on Extinguishment of Debt, Non-Cash Adjustment Impairment of Goodwill, Non-Cash Adjustment 73 74 Changes in Operating Capital 75 Change in Inventories 76 Change in Trade and Other Receivables 77 Change in Trade/Accounts Receivable 78 Change in Payables and Accrued Expenses 79 Change in Trade and Other Payables 80 Change in Trade/Accounts Payable 81 Change in Other Operating Capital Other Operating Cash Flow 82 83 Cash Flow from Investing Activities 84 Cash Flow from Continuing Investing Activities 85 Capital Expenditure, Reported 86 Purchase/Sale of Business, Net 87 Purchase/Acquisition of Business 88 Purchase/Sale of Investments, Net 89 Purchase of Investments 90 Sale of Investments 91 Purchase/Salle of Other Non-Current Assets, Net Sales of Other Non-Current Assets 92 93 Change in 94 Cash Flow from Finanted Cash and Cash Equivalents Activities 95 Cash Flow from Continuing Financing Activities Issuance of/Payments for Common Stock, Net Payments for Common Stock 96 97 98 Issuance of/Repayments for Debt, Net 99 Issuance of/Repayments for Short Term Debt, Net 100 Issuance of/Repayments for Long Term Debt, Net 101 Proceeds from Issuance of Long Term Debt Repayments for Long Term Debt 102 103 Cash Dividends and Interest Paid 104 Cash Dividends Paid 105 Proceeds from Issuance/Exercising of Stock Options/Warrants 106 Cash and Cash Equivalents, End of Period 107 Change in Cash 108 Effect of Exchange Rate Changes 109 Cash and Cash Equivalents, Beginning of Period 110 Cash Flow Supplemental Section 111 Change in Cash as Reported, Supplemental 112 Income Tax Paid, Supplemental 113 Interest Paid, Supplemental 114 Fiscal year ends in Jun 30 | USD 115 116 H7 7 T Y 7 Y T T B 2017 12,753,000,000 12,753,000,000 12,591,000,000 15,411,000,000 -2,377.000.000 2,820,000,000 2,820,000,000 351,000,000 -601,000,000 -4,947,000,000 -5,490,000,000 -5,490,000,000 0 543,000,000 0 -443,000,000 71,000,000 -322,000,000 -322,000,000 -149.000.000 -149,000,000 -149,000,000 -43,000,000 162,000,000 -5,689,000,000 -5,689,000,000 -3,384,000,000 -491,000,000 -491,000,000 -3,381,000,000 -4,869,000,000 1,488,000,000 571,000,000 571,000,000 996,000,000 -8,568,000,000 -8,568,000,000 -5,204,000,000 -5,204,000,000 1,399,000,000 2.727,000,000 -1,328,000,000 3,603,000,000 -4,931,000,000 -7,236,000,000 -7,236,000,000 2,473,000,000 5,569,000,000 -1,504,000,000 -29,000,000 7,102,000,000 -1,533,000,000 -3,714,000,000 -518,000,000 T C 2018 7 14,867,000,000 14,867,000,000 14,436,000,000 9,861,000,000 1,555,000,000 2,834,000,000 2,834,000,000 395,000,000 -1,844,000,000 170,000,000 -176,000,000 -176,000,000 346,000,000 T 3,020,000,000 -188,000,000 -177,000,000 -177,000,000 1,385,000.000 1,385,000,000 1,385,000,000 2,000,000,000 431,000,000 -3,511,000,000 -3,511,000,000 -3,717,000,000 -109,000,000 -109,000,000 46,000,000 -3,909,000,000 3,955,000,000 269,000,000 269,000,000 -14,375,000,000 -14,375,000,000 -7,004,000,000 -7,004,000,000 -1,238,000,000 -3.437,000.000 2,199,000,000 5,072,000,000 -2,873.000.000 -7,310,000,000 -7,310,000,000 1,177,000,000 2,569,000,000 -3,019,000,000 19,000,000 5,569,000,000 -3,000,000,000 -2,830,000,000 -529,000,000 D 2019 15,242,000,000 15,242,000,000 14,929,000,000 3,966,000,000 10,595,000,000 2,824,000,000 2,824,000,000 515,000,000 -411,000,000 7,667,000,000 -678,000,000 -678,000,000 8,345,000,000 368.000.000 -239,000,000 -276,000,000 -276,000,000 1,856,000,000 0 1,856,000,000 1,856,000,000 -973,000,000 313,000,000 -3,490,000,000 -3,490,000,000 -3,347,000,000 -3,945,000,000 -3.945.000.000 3,408,000,000 -220,000,000 3,628,000,000 394,000,000 394,000,000 -9,994,000,000 -9,994,000,000 -5,003,000,000 -5,003,000,000 -817,000,000 -2,215,000,000 1,398,000,000 2,367,000,000 -969,000,000 -7,498,000,000 -7,498,000,000 3,324,000,000 4,239,000,000 1,758,000,000 -88,000,000 2,569,000,000 1,670,000,000 -3,064,000,000 -497,000,000 Y 07 E 2020 17,403,000,000 17,403,000,000 17,295.000.000 13,103,000,000 2,982,000,000 3,013,000,000 3,013,000,000 558,000,000 -596,000,000 7,000,000 7,000,000 7,000,000 0 0 1,210,000,000 -637,000,000 634,000,000 634,000,000 1,923,000,000 1,923,000,000 1,923,000,000 -710,000,000 108,000,000 27 3,045,000,000 3,045,000,000 -3,073,000,000 57 -58,000,000 -58,000,000 6,146,000,000 -5,000,000 6,151,000,000 30,000,000 30,000,000 -8.367,000.000 -8,367,000,000 -7,405,000,000 -7,405,000,000 4,849,000,000 2,345,000,000 2,504,000,000 4,951,000,000 -2,447,000,000 -7,789,000,000 -7,789,000,000 1,978,000,000 16,181,000,000 12,081,000,000 -139,000,000 4,239,000,000 11,942,000,000 -3,550,000,000 -434.000.000 Y 07 Formatting as Table Styles F G H 2021 18,371,000,000 18,371,000,000 18,236,000,000 14,352,000,000 3,513,000,000 2,735,000,000 2,735,000,000 540,000,000 -258,000,000 496,000,000 -16.000.000 -16,000,000 512,000,000 0 371,000,000 -309,000,000 -342,000,000 -342,000,000 1.391,000,000 1,391,000,000 1,391,000,000 -369,000,000 135,000,000 -2,834,000,000 -2,834,000,000 -2,787,000,000 -34,000,000 -34,000,000 -55,000,000 -55,000,000 0 42,000,000 42,000,000 -21,531,000,000 -21,531,000,000 -11,009,000,000 -11,009,000,000 -3,903,000,000 -3,333,000,000 -570,000.000 4,417,000,000 -4,987,000,000 -8,263,000,000 -8.263,000,000 1,644,000,000 10,288,000,000 -5,994,000,000 101,000,000 16,181,000,000 -5,893,000,000 -3,822,000,000 -531,000,000 B I B28 fx A B 3 Market Prices from Internet 4 5 6 7 Liquidity 8 Current ratio 9 Quick ratio 10 11 Financial Leverage 12 Total Debt ratio 13 TIE ratio 14 15 Asset Management 16 A/R Turnover 17 DSO 18 Inventory Turnover 19 Inventory Days 20 Total Asset Turnover 21 22 Profitability 23 Net Profit Margin 24 ROA 25 ROE 26 27 Market Value 28 Price 29 P/E 30 P/B 31 32 33 D Fiscal year ends in June 30 2018 2019 2020 0.826 0.749 0.849 0.658 0.582 0.682 0.553 0.587 0.612 63.880 57.633 60.384 14.403 14.047 15.546 25.341 25.985 23.479 14.277 13.877 13.495 49.859 51.205 54.439 0.560 0.580 0.168 0.175 0.180 0.094 0.102 0.108 0.212 0.250 0.272 E F G H7 x fx A PG income-statement_Annual_As_Originally_ Reported PG_balance-sheet_Annual_As_Originally Reported 2 3 Total Revenue 4 Cost of Revenue 5 Depreciation, Amortization and Depletion 6 Total Operating Income 7 Net Interest Income/Expense 8 Pretax Income 9 Provision for Income Tax 10 Net Income Available to Common Stockholders 11 Diluted Weighted Average Shares Outstanding 12 Total Dividend Per Share 13 Fiscal year ends in Jun 30 | USD 14 15 16 Cash, Cash Equivalents and Short Term Investments 17 Trade/Accounts Receivable, Current 18 Inventories 19 Prepayments and Deposits, Current 20 Total Current Assets 21 22 Net Property, Plant and Equipment 23 Net Intangible Assets 24 Other Non-Current Assets 25 Total Fixed Assets 26 27 Total Assets 28 29 30 Trade and Other Payables, Current 31 Accrued Expenses, Current 32 Short Term Debt, Current 33 Provisions, Current 34 Other Current Liabilities 35 Total Current Liabilities 36 37 Long Term Debt 38 Provisions, Non-Current 39 Tax Liabilities. Non-Current 40 Taxes Payable, Non-Current 41 Other Non-Current Liabilities 42 Total Non-Current Liabilities 43 44 Total Liabilities 45 46 Total Equity 47 48 Total Liabilities +Total Equity 49 Fiscal year ends in Jun 30 | USD 50 Dali B C D E F 2017 2019 2021 2018 $66,832,000,000 $67,684,000,000 2020 $70,950,000,000 $76,118,000,000 $65,058,000,000 $32,535,000,000 $34,268,000,000 $34,768,000,000 $35,250,000,000 $37,108,000,000 $3,013,000,000 $2,735,000,000 $2,820,000,000 $13,955,000,000 $15,706,000,000 $17,986,000,000 $310,000,000 $457,000,000 $2,834,000,000 $2,824,000,000 $13,711,000,000 $13,832,000,000 $294,000,000 $259,000,000 $289,000,000 $13,257,000,000 $13,326,000,000 $13,543,000,000 $15,834,000,000 $17,615,000,000 $3,063,000,000 $3,465,000,000 $10,732,000,000 $11,204,000,000 2,740,400,000 2,656,700,000 $3,263,000,000 $2,895,715,000 $2,731,000,000 $11,877,000,000 $12,764,000,000 2,539,500,000 2,625,800,000 $3.03 $14,035,000,000 2,601,000,000 $3.24 $2.70 $2.79 $2.90 2018 $11,850,000,000 $4,686,000,000 2019 $10,287,000,000 $4,951,000,000 2020 $16,181,000,000 $4,178,000,000 2017 $15,137,000,000 $4,594,000,000 $4,624,000,000 $2,139,000,000 $26,494,000,000 $23,320,000,000 $22,473,000,000 $27,987,000,000 2021 $10,288,000,000 $4,725,000,000 $5,983,000,000 $2,095,000,000 $5,017,000,000 $5,498,000,000 $4,738,000,000 $2,046,000,000 $2,218,000,000 $2,130,000,000 $23,091,000,000 $21,686,000,000 $64,566,000,000 $19,893,000,000 $20,600,000,000 $21,271,000,000 $20,692,000,000 $68,886,000,000 $69,077,000,000 $64,488,000,000 $63,693,000,000 $5,133,000,000 $5,313,000,000 $6,863,000,000 $93,912,000,000 $94,990,000,000 $92,622,000,000 $8,328,000,000 $9.964,000,000 $92,713,000,000 $96,216,000,000 $120,406,000,000 $118,310,000,000 $115,095,000,000 $120,700,000,000 $119,307,000,000 $14,357,000,000 $10,081,000,000 $10,612,000,000 $11,601,000,000 $12,764,000,000 $2,960,000,000 $4,299,000,000 $3,531,000,000 $4,359,000,000 $3,364,000,000 $13,554,000,000 $10,423,000,000 $9,697,000,000 $11,183,000,000 $8,889,000,000 $1,621,000,000 $1,811,000,000 $2,091,000,000 $2,393,000,000 $2,423,000,000 $1,994,000,000 $2,027,000,000 $2,323,000,000 $3,105,000,000 $3,104,000,000 $30,210,000,000 $28,237,000,000 $30,011,000,000 $32,976,000,000 $33,132,000,000 $18,038,000,000 $20,863,000,000 $20,395,000,000 $24,189,000,000 $23,730,000,000 $6,820,000,000 $6,263,000,000 $6,720,000,000 $7,188,000,000 $6,374,000,000 $8,126,000,000 $6,163,000,000 $6,899,000,000 $6,199,000,000 S6,153,000,000 $2,654,000,000 $2,343,000,000 $2,121,000,000 $1,891,000,000 $1,373,000,000 $1,434,000,000 $1,247,000,000 $1,148,000,000 $1,149,000,000 $34,418,000,000 $37,190,000,000 $37,505,000,000 $40,846,000,000 $39,521,000,000 $64,628,000,000 $65,427,000,000 $67,516,000,000 $73,822,000,000 $72,653,000,000 $55,778,000,000 $52,883,000,000 $47,579,000,000 $46,878,000,000 $46,654,000,000 $120,406,000,000 $118,310,000,000 $115,095,000,000 $120,700,000,000 $119,307,000,000 G x fx A 57 58 PG_cash-flow_Annual_As_Originally_Reported 59 Cash Flow from Operating Activities, Indirect 60 Net Cash Flow from Continuing Operating Activities, Indirect 61 Cash Generated from Operating Activities 62 Income/Loss before Non-Cash Adjustment 63 Total Adjustments for Non-Cash Items 64 Depreciation, Amortization and Depletion, Non-Cash Adjustment Depreciation and Amortization, Non-Cash Adjustment 65 66 Stock-Based Compensation, Non-Cash Adjustment 67 Taxes, Non-Cash Adjustment 68 Irregular Income/Loss, Non-Cash Adjustment 69 Gain/Loss on Disposals, Non-Cash Adjustment 70 71 72 Gain/Loss on Disposal/Sale of Other Assets, Non-Cash Adjustment Gain/Loss on Disposal/Sale of Business, Non-Cash Adjustment Gain/Loss on Extinguishment of Debt, Non-Cash Adjustment Impairment of Goodwill, Non-Cash Adjustment 73 74 Changes in Operating Capital 75 Change in Inventories 76 Change in Trade and Other Receivables 77 Change in Trade/Accounts Receivable 78 Change in Payables and Accrued Expenses 79 Change in Trade and Other Payables 80 Change in Trade/Accounts Payable 81 Change in Other Operating Capital Other Operating Cash Flow 82 83 Cash Flow from Investing Activities 84 Cash Flow from Continuing Investing Activities 85 Capital Expenditure, Reported 86 Purchase/Sale of Business, Net 87 Purchase/Acquisition of Business 88 Purchase/Sale of Investments, Net 89 Purchase of Investments 90 Sale of Investments 91 Purchase/Salle of Other Non-Current Assets, Net Sales of Other Non-Current Assets 92 93 Change in 94 Cash Flow from Finanted Cash and Cash Equivalents Activities 95 Cash Flow from Continuing Financing Activities Issuance of/Payments for Common Stock, Net Payments for Common Stock 96 97 98 Issuance of/Repayments for Debt, Net 99 Issuance of/Repayments for Short Term Debt, Net 100 Issuance of/Repayments for Long Term Debt, Net 101 Proceeds from Issuance of Long Term Debt Repayments for Long Term Debt 102 103 Cash Dividends and Interest Paid 104 Cash Dividends Paid 105 Proceeds from Issuance/Exercising of Stock Options/Warrants 106 Cash and Cash Equivalents, End of Period 107 Change in Cash 108 Effect of Exchange Rate Changes 109 Cash and Cash Equivalents, Beginning of Period 110 Cash Flow Supplemental Section 111 Change in Cash as Reported, Supplemental 112 Income Tax Paid, Supplemental 113 Interest Paid, Supplemental 114 Fiscal year ends in Jun 30 | USD 115 116 H7 7 T Y 7 Y T T B 2017 12,753,000,000 12,753,000,000 12,591,000,000 15,411,000,000 -2,377.000.000 2,820,000,000 2,820,000,000 351,000,000 -601,000,000 -4,947,000,000 -5,490,000,000 -5,490,000,000 0 543,000,000 0 -443,000,000 71,000,000 -322,000,000 -322,000,000 -149.000.000 -149,000,000 -149,000,000 -43,000,000 162,000,000 -5,689,000,000 -5,689,000,000 -3,384,000,000 -491,000,000 -491,000,000 -3,381,000,000 -4,869,000,000 1,488,000,000 571,000,000 571,000,000 996,000,000 -8,568,000,000 -8,568,000,000 -5,204,000,000 -5,204,000,000 1,399,000,000 2.727,000,000 -1,328,000,000 3,603,000,000 -4,931,000,000 -7,236,000,000 -7,236,000,000 2,473,000,000 5,569,000,000 -1,504,000,000 -29,000,000 7,102,000,000 -1,533,000,000 -3,714,000,000 -518,000,000 T C 2018 7 14,867,000,000 14,867,000,000 14,436,000,000 9,861,000,000 1,555,000,000 2,834,000,000 2,834,000,000 395,000,000 -1,844,000,000 170,000,000 -176,000,000 -176,000,000 346,000,000 T 3,020,000,000 -188,000,000 -177,000,000 -177,000,000 1,385,000.000 1,385,000,000 1,385,000,000 2,000,000,000 431,000,000 -3,511,000,000 -3,511,000,000 -3,717,000,000 -109,000,000 -109,000,000 46,000,000 -3,909,000,000 3,955,000,000 269,000,000 269,000,000 -14,375,000,000 -14,375,000,000 -7,004,000,000 -7,004,000,000 -1,238,000,000 -3.437,000.000 2,199,000,000 5,072,000,000 -2,873.000.000 -7,310,000,000 -7,310,000,000 1,177,000,000 2,569,000,000 -3,019,000,000 19,000,000 5,569,000,000 -3,000,000,000 -2,830,000,000 -529,000,000 D 2019 15,242,000,000 15,242,000,000 14,929,000,000 3,966,000,000 10,595,000,000 2,824,000,000 2,824,000,000 515,000,000 -411,000,000 7,667,000,000 -678,000,000 -678,000,000 8,345,000,000 368.000.000 -239,000,000 -276,000,000 -276,000,000 1,856,000,000 0 1,856,000,000 1,856,000,000 -973,000,000 313,000,000 -3,490,000,000 -3,490,000,000 -3,347,000,000 -3,945,000,000 -3.945.000.000 3,408,000,000 -220,000,000 3,628,000,000 394,000,000 394,000,000 -9,994,000,000 -9,994,000,000 -5,003,000,000 -5,003,000,000 -817,000,000 -2,215,000,000 1,398,000,000 2,367,000,000 -969,000,000 -7,498,000,000 -7,498,000,000 3,324,000,000 4,239,000,000 1,758,000,000 -88,000,000 2,569,000,000 1,670,000,000 -3,064,000,000 -497,000,000 Y 07 E 2020 17,403,000,000 17,403,000,000 17,295.000.000 13,103,000,000 2,982,000,000 3,013,000,000 3,013,000,000 558,000,000 -596,000,000 7,000,000 7,000,000 7,000,000 0 0 1,210,000,000 -637,000,000 634,000,000 634,000,000 1,923,000,000 1,923,000,000 1,923,000,000 -710,000,000 108,000,000 27 3,045,000,000 3,045,000,000 -3,073,000,000 57 -58,000,000 -58,000,000 6,146,000,000 -5,000,000 6,151,000,000 30,000,000 30,000,000 -8.367,000.000 -8,367,000,000 -7,405,000,000 -7,405,000,000 4,849,000,000 2,345,000,000 2,504,000,000 4,951,000,000 -2,447,000,000 -7,789,000,000 -7,789,000,000 1,978,000,000 16,181,000,000 12,081,000,000 -139,000,000 4,239,000,000 11,942,000,000 -3,550,000,000 -434.000.000 Y 07 Formatting as Table Styles F G H 2021 18,371,000,000 18,371,000,000 18,236,000,000 14,352,000,000 3,513,000,000 2,735,000,000 2,735,000,000 540,000,000 -258,000,000 496,000,000 -16.000.000 -16,000,000 512,000,000 0 371,000,000 -309,000,000 -342,000,000 -342,000,000 1.391,000,000 1,391,000,000 1,391,000,000 -369,000,000 135,000,000 -2,834,000,000 -2,834,000,000 -2,787,000,000 -34,000,000 -34,000,000 -55,000,000 -55,000,000 0 42,000,000 42,000,000 -21,531,000,000 -21,531,000,000 -11,009,000,000 -11,009,000,000 -3,903,000,000 -3,333,000,000 -570,000.000 4,417,000,000 -4,987,000,000 -8,263,000,000 -8.263,000,000 1,644,000,000 10,288,000,000 -5,994,000,000 101,000,000 16,181,000,000 -5,893,000,000 -3,822,000,000 -531,000,000 B