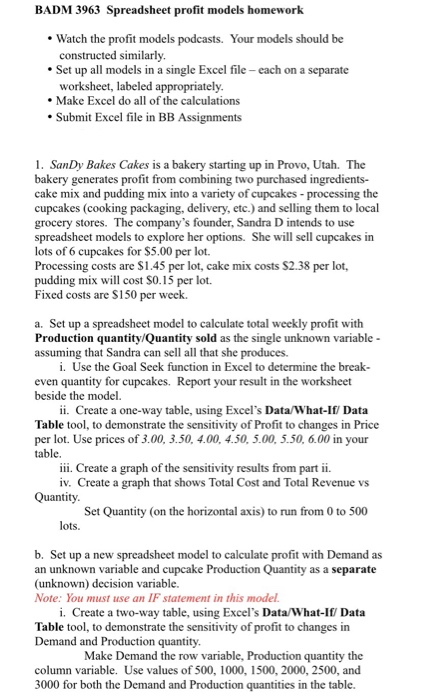
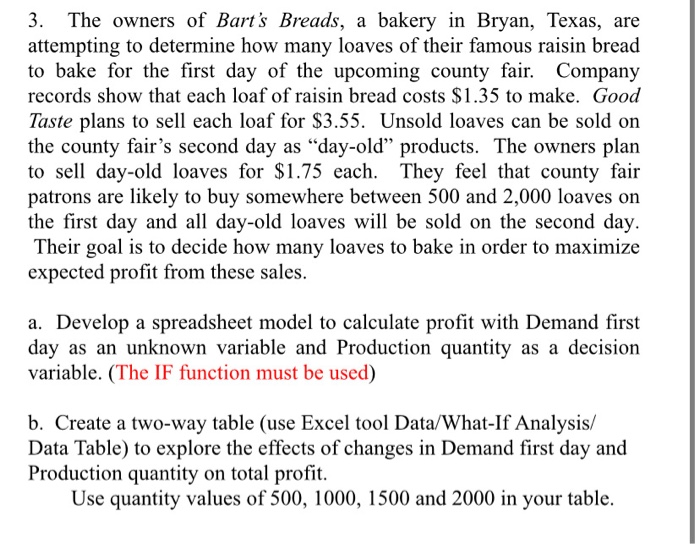
BADM 3963 Spreadsheet profit models homework Watch the profit models podcasts. Your models should be constructed similarly, Set up all models in a single Excel file - each on a separate worksheet, labeled appropriately. Make Excel do all of the calculations Submit Excel file in BB Assignments 1. SanDy Bakes Cakes is a bakery starting up in Provo, Utah. The bakery generates profit from combining two purchased ingredients- cake mix and pudding mix into a variety of cupcakes - processing the cupcakes (cooking packaging, delivery, etc.) and selling them to local grocery stores. The company's founder, Sandra D intends to use spreadsheet models to explore her options. She will sell cupcakes in lots of 6 cupcakes for $5.00 per lot. Processing costs are $1.45 per lot, cake mix costs $2.38 per lot, pudding mix will cost $0.15 per lot. Fixed costs are $150 per week. a. Set up a spreadsheet model to calculate total weekly profit with Production quantity/Quantity sold as the single unknown variable- assuming that Sandra can sell all that she produces. i. Use the Goal Seek function in Excel to determine the break- even quantity for cupcakes. Report your result in the worksheet beside the model. ii. Create a one-way table, using Excel's Data/What-If/ Data Table tool, to demonstrate the sensitivity of Profit to changes in Price per lot. Use prices of 3.00, 3.50, 4.00, 4.50, 5.00, 5.50, 6.00 in your table. iii. Create a graph of the sensitivity results from part ii. iv. Create a graph that shows Total Cost and Total Revenue vs Quantity Set Quantity (on the horizontal axis) to run from 0 to 500 lots. b. Set up a new spreadsheet model to calculate profit with Demand as an unknown variable and cupcake Production Quantity as a separate (unknown) decision variable. Note: You must use an IF statement in this model. i. Create a two-way table, using Excel's Data/What-If Data Table tool, to demonstrate the sensitivity of profit to changes in Demand and Production quantity. Make Demand the row variable, Production quantity the column variable. Use values of 500, 1000, 1500, 2000, 2500, and 3000 for both the Demand and Production quantities in the table. 3. The owners of Bart's Breads, a bakery in Bryan, Texas, are attempting to determine how many loaves of their famous raisin bread to bake for the first day of the upcoming county fair. Company records show that each loaf of raisin bread costs $1.35 to make. Good Taste plans to sell each loaf for $3.55. Unsold loaves can be sold on the county fair's second day as "day-old products. The owners plan to sell day-old loaves for $1.75 each. They feel that county fair patrons are likely to buy somewhere between 500 and 2,000 loaves on the first day and all day-old loaves will be sold on the second day. Their goal is to decide how many loaves to bake in order to maximize expected profit from these sales. a. Develop a spreadsheet model to calculate profit with Demand first day as an unknown variable and Production quantity as a decision variable. (The IF function must be used) b. Create a two-way table (use Excel tool Data/What-If Analysis/ Data Table) to explore the effects of changes in Demand first day and Production quantity on total profit. Use quantity values of 500, 1000, 1500 and 2000 in your table. BADM 3963 Spreadsheet profit models homework Watch the profit models podcasts. Your models should be constructed similarly, Set up all models in a single Excel file - each on a separate worksheet, labeled appropriately. Make Excel do all of the calculations Submit Excel file in BB Assignments 1. SanDy Bakes Cakes is a bakery starting up in Provo, Utah. The bakery generates profit from combining two purchased ingredients- cake mix and pudding mix into a variety of cupcakes - processing the cupcakes (cooking packaging, delivery, etc.) and selling them to local grocery stores. The company's founder, Sandra D intends to use spreadsheet models to explore her options. She will sell cupcakes in lots of 6 cupcakes for $5.00 per lot. Processing costs are $1.45 per lot, cake mix costs $2.38 per lot, pudding mix will cost $0.15 per lot. Fixed costs are $150 per week. a. Set up a spreadsheet model to calculate total weekly profit with Production quantity/Quantity sold as the single unknown variable- assuming that Sandra can sell all that she produces. i. Use the Goal Seek function in Excel to determine the break- even quantity for cupcakes. Report your result in the worksheet beside the model. ii. Create a one-way table, using Excel's Data/What-If/ Data Table tool, to demonstrate the sensitivity of Profit to changes in Price per lot. Use prices of 3.00, 3.50, 4.00, 4.50, 5.00, 5.50, 6.00 in your table. iii. Create a graph of the sensitivity results from part ii. iv. Create a graph that shows Total Cost and Total Revenue vs Quantity Set Quantity (on the horizontal axis) to run from 0 to 500 lots. b. Set up a new spreadsheet model to calculate profit with Demand as an unknown variable and cupcake Production Quantity as a separate (unknown) decision variable. Note: You must use an IF statement in this model. i. Create a two-way table, using Excel's Data/What-If Data Table tool, to demonstrate the sensitivity of profit to changes in Demand and Production quantity. Make Demand the row variable, Production quantity the column variable. Use values of 500, 1000, 1500, 2000, 2500, and 3000 for both the Demand and Production quantities in the table. 3. The owners of Bart's Breads, a bakery in Bryan, Texas, are attempting to determine how many loaves of their famous raisin bread to bake for the first day of the upcoming county fair. Company records show that each loaf of raisin bread costs $1.35 to make. Good Taste plans to sell each loaf for $3.55. Unsold loaves can be sold on the county fair's second day as "day-old products. The owners plan to sell day-old loaves for $1.75 each. They feel that county fair patrons are likely to buy somewhere between 500 and 2,000 loaves on the first day and all day-old loaves will be sold on the second day. Their goal is to decide how many loaves to bake in order to maximize expected profit from these sales. a. Develop a spreadsheet model to calculate profit with Demand first day as an unknown variable and Production quantity as a decision variable. (The IF function must be used) b. Create a two-way table (use Excel tool Data/What-If Analysis/ Data Table) to explore the effects of changes in Demand first day and Production quantity on total profit. Use quantity values of 500, 1000, 1500 and 2000 in your table