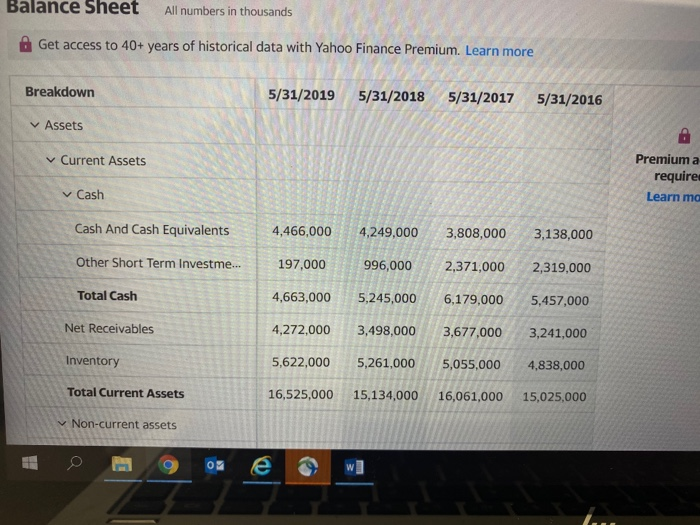
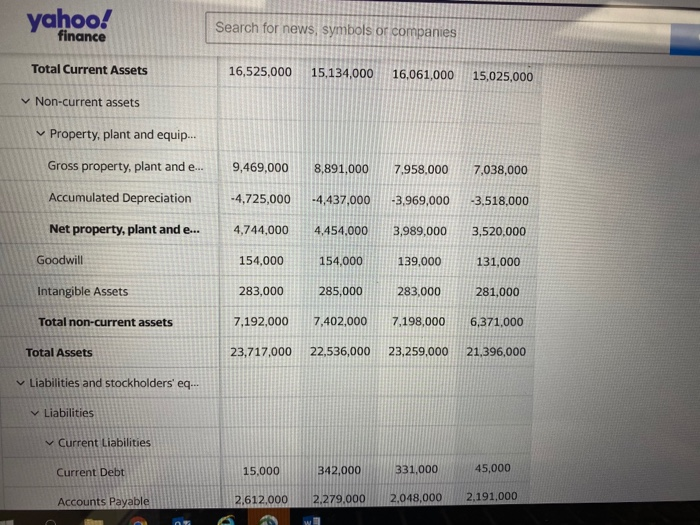
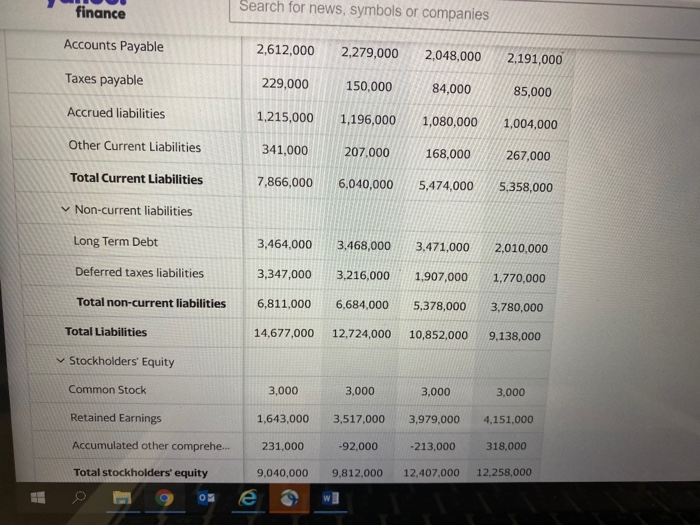
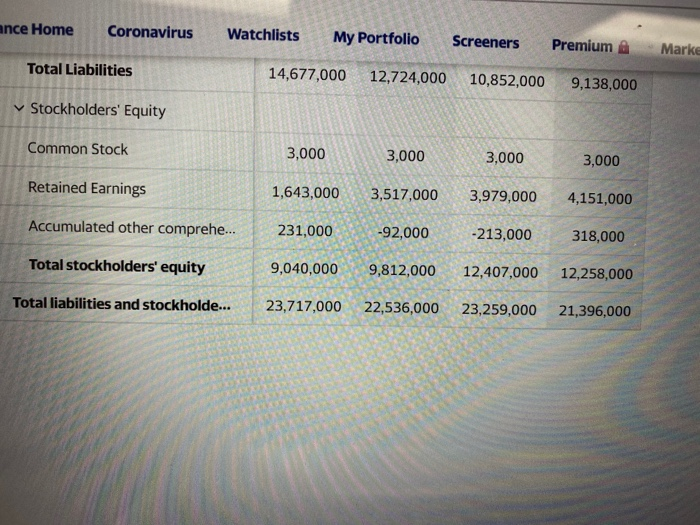
Balance Sheet Information for "Nike Inc 2019 year stats".
- What was the total amount of inventories for the most recent fiscal year?
- What accounting method was used to determine the cost of inventory? (INVENTORY METHOD USED)
- Compute the Inventory Turnover for the most current year. [Cost of Goods Sold / Average Inventory]
- What was the BOOK VALUE of property, plant and equipment for the most recent fiscal year?
- What accounting method was used to compute DEPRECIATION?
Balance sheet All numbers in thousands & Get access to 40+ years of historical data with Yahoo Finance Premium. Learn more Breakdown 5/31/2019 5/31/2018 5/31/2017 5/31/2016 Assets Current Assets Premium a require Learn mo Cash Cash And Cash Equivalents 4,466,000 4,249,000 3,808,000 3,138,000 Other Short Term Investme... 197,000 996,000 2,371,000 2,319,000 Total Cash 4,663,000 4,272,000 5,245,000 3,498,000 6,179,000 3,677,000 5,457,000 3,241,000 Net Receivables Inventory 5,622,000 16,525,000 5,261,000 15,134,000 5,055,000 16,061,000 4,838,000 15,025,000 Total Current Assets Non-current assets 02 yahoo! Search for news, symbols or companies finance Total Current Assets 16,525,000 15,134,000 16,061,000 15,025,000 Non-current assets Property, plant and equip... 9,469,000 8,891,000 7,958,000 7,038,000 Gross property, plant and e... Accumulated Depreciation -4,725,000 -4,437,000 -3,969,000 -3,518,000 Net property, plant and e... 4,744,000 4,454,000 3,989,000 3,520,000 Goodwill 154,000 154,000 139,000 131,000 Intangible Assets 283,000 285,000 283,000 281,000 Total non-current assets 7,192,000 7,402,000 7.198,000 6,371,000 Total Assets 23,717,000 22,536,000 23,259,000 21,396,000 Liabilities and stockholders' eq... Liabilities Current Liabilities Current Debt 15,000 342,000 331,000 45,000 Accounts Payable 2.612.000 2.279.000 2.048,000 2,191,000 finance Search for news, symbols or companies Accounts Payable 2,612,000 2,279,000 2,048,000 2.191,000 Taxes payable 229,000 150,000 84,000 85,000 Accrued liabilities 1,215,000 1,196,000 1,080,000 1,004,000 Other Current Liabilities 341,000 207,000 168,000 267,000 Total Current Liabilities 7,866,000 6,040,000 5,474,000 5,358,000 Non-current liabilities Long Term Debt 3,464,000 3,468,000 3,471,000 2,010,000 Deferred taxes liabilities 3,347,000 3,216,000 1,907,000 1,770,000 Total non-current liabilities 6,811,000 6,684,000 5,378,000 3,780,000 Total Liabilities 14,677,000 12,724,000 10,852,000 9,138,000 Stockholders' Equity Common Stock 3,000 3,000 3,000 Retained Earnings 1,643,000 3,517,000 3,000 3,979,000 -213,000 4,151,000 Accumulated other comprehe... 231,000 -92,000 318,000 Total stockholders' equity 9,040,000 9,812,000 12,407,000 12.258,000 ance Home Coronavirus Watchlists My Portfolio Screeners Premium 14,677,000 12,724,000 10,852,000 9,138,000 Marke Total Liabilities Stockholders' Equity Common Stock 3,000 3,000 3,000 3,000 3,517,000 Retained Earnings 1,643,000 3,979,000 4,151,000 Accumulated other comprehe... 231,000 -92,000 -213,000 318,000 Total stockholders' equity Total liabilities and stockholde... 9,040,000 23,717,000 9,812,000 22,536,000 12,407,000 23,259,000 12,258,000 21,396,000


