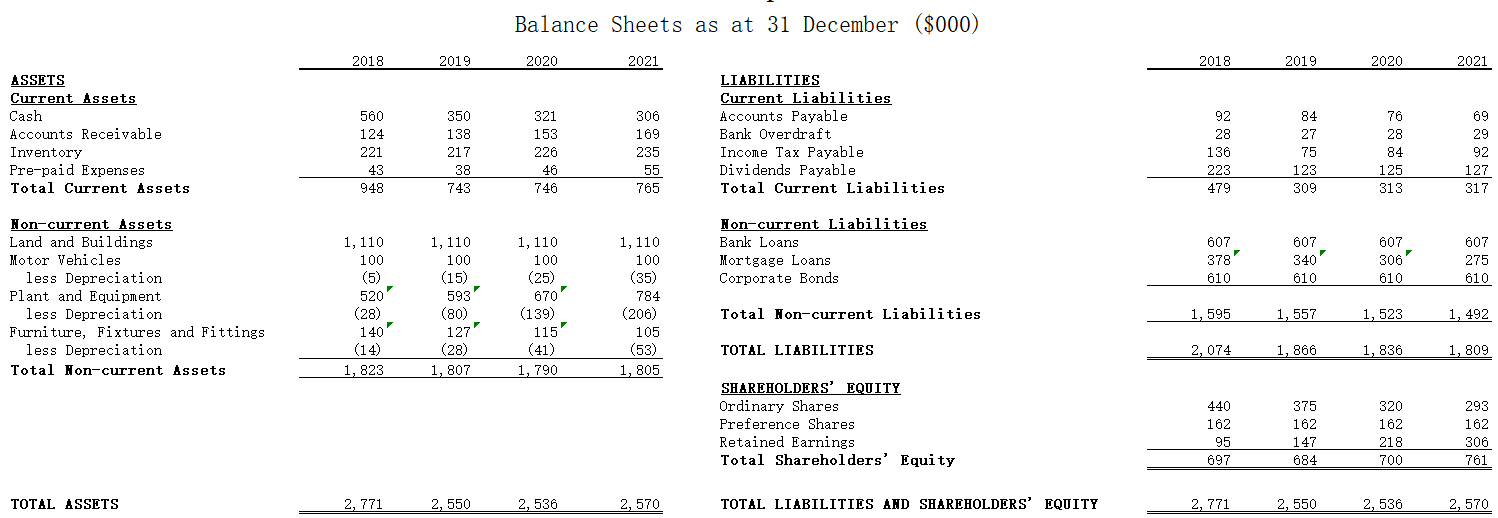
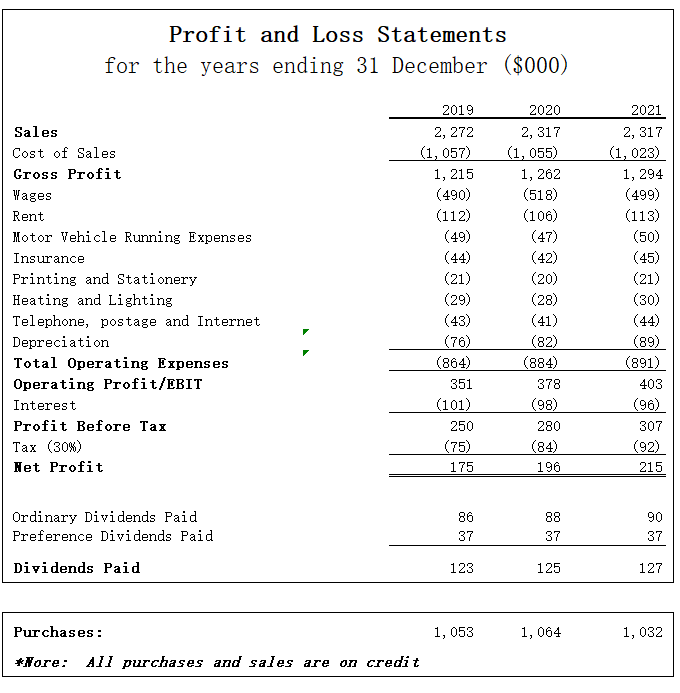
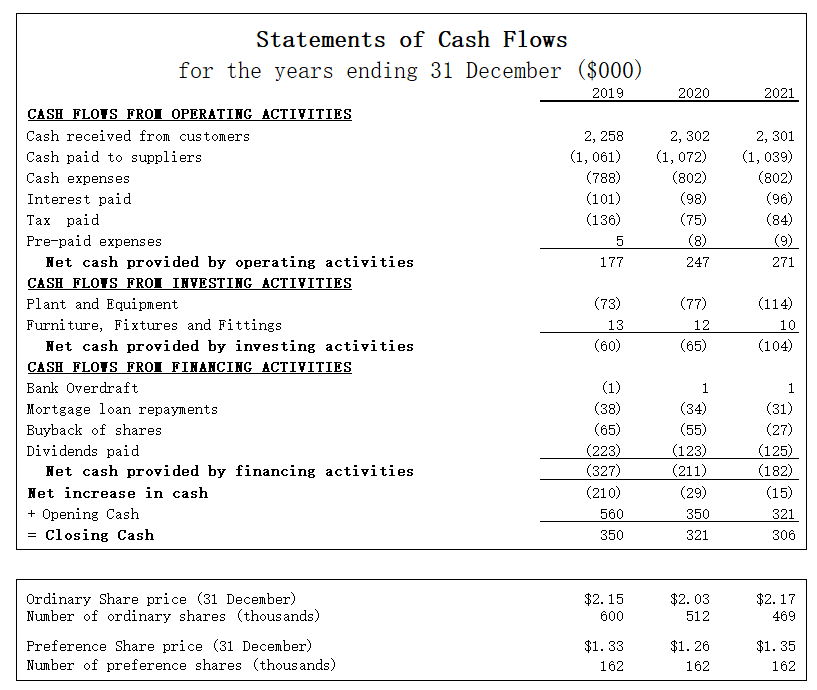
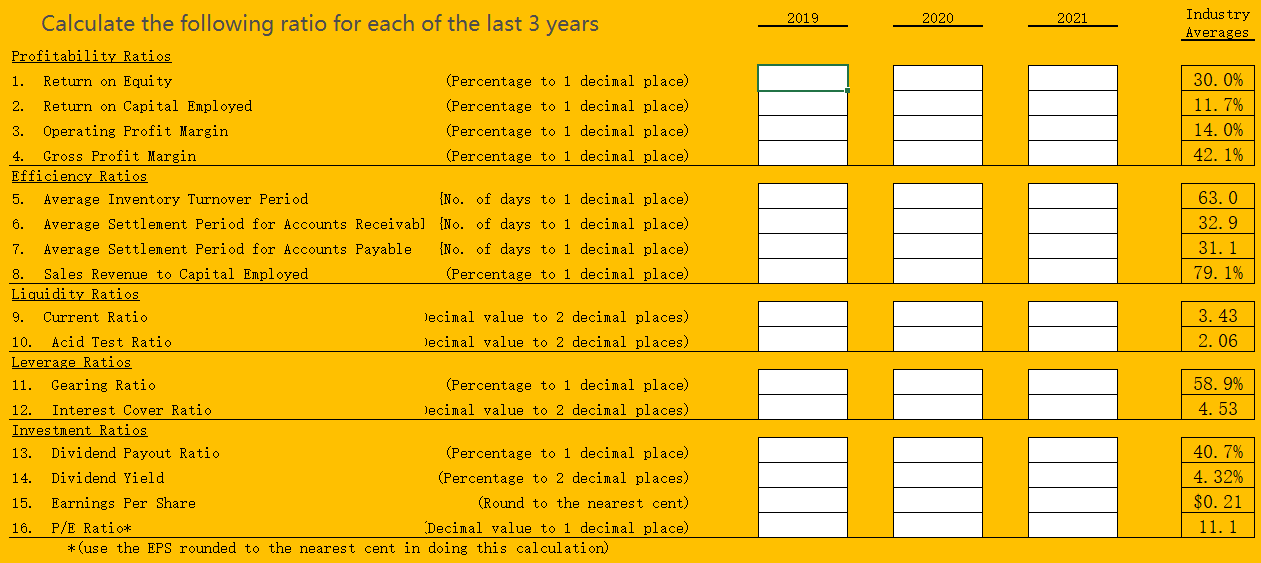
Balance Sheets as at 31 December ($000) 2019 2020 2021 2018 2019 2020 2021 321 306 92 84 ASSETS Current Assets Cash Accounts Receivable Inventory Pre-paid Expenses Total Current Assets 560 124 221 350 138 217 153 169 LIABILITIES Current Liabilities Accounts Payable Bank Overdraft Income Tax Payable Dividends Payable Total Current Liabilities 235 136 92 38 226 46 746 55 27 75 123 309 223 127 948 125 313 743 765 479 317 1, 110 100 1, 110 100 (15) 1, 110 100 (25) Non-current Liabilities Bank Loans Mortgage Loans Corporate Bonds 607 378 610 607 340 607 306 610 607 275 610 610 Non-current Assets Land and Buildings Motor Vehicles less Depreciation Plant and Equipment less Depreciation Furniture, Fixtures and Fittings less Depreciation Total Non-current Assets 1, 110 100 (35) 784 (206) 105 593 (5) 520' (28) 140 6701 (80) (139) Total Non-current Liabilities 1,595 1,557 1,523 1, 492 127 115 (53) TOTAL LIABILITIES 2,074 1,866 1,836 1, 809 (14) (28) (41) 1, 8231, 8071, 790 1,805 SHAREHOLDERS' EQUITY Ordinary Shares Preference Shares Retained Earnings Total Shareholders' Equity 440 162 375 162 147 684 320 162 218 700 293 162 306 761 95 697 TOTAL ASSETS 2, 771 2,550 2,536 2,570 TOTAL LIABILITIES AND SHAREHOLDERS' EQUITY 2,771 2, 550 2,536 2,570 Profit and Loss Statements for the years ending 31 December ($000) 2021 Sales Cost of Sales Gross Profit Yages 2019 2, 272 (1,057) 1, 215 (490) (112) (49) 2020 2,317 (1,055) 1, 262 (518) (106) (47) (42) (20) Rent (44) (28) Motor Vehicle Running Expenses Insurance Printing and Stationery Heating and Lighting Telephone, postage and Internet Depreciation Total Operating Expenses Operating Profit/EBIT Interest Profit Before Tax Tax (30%) Net Profit (21) (29) (43) (76) (864) 2, 317 (1, 023) 1, 294 (499) (113) (50) (45) (21) (30) (44) (89) (891) 403 (96) 307 (92) 215 351 (41) (82) (884) 378 (98) 280 (84) (101) 250 (75) 175 196 Ordinary Dividends Paid Preference Dividends Paid Dividends Paid 123 125 127 Purchases: 1,053 1,064 1,032 *Nore: All purchases and sales are on credit 2020 2021 2,302 (1,072) (802) (98) (75) (8) 247 2, 301 (1,039) (802) (96) (84) (9) 271 Statements of Cash Flows for the years ending 31 December ($000) 2019 CASH FLOTS FROI OPERATING ACTIVITIES Cash received from customers 2, 258 Cash paid to suppliers (1,061) Cash expenses (788) Interest paid (101) Tax paid (136) Pre-paid expenses 5 Net cash provided by operating activities 177 CASH FLOTS FROI INVESTING ACTIVITIES Plant and Equipment (73) Furniture, Fixtures and Fittings 13 Net cash provided by investing activities (60) CASH FLOTS FROI FINANCING ACTIVITIES Bank Overdraft Mortgage loan repayments (38) Buyback of shares (65) Dividends paid (223) Net cash provided by financing activities (327) Het increase in cash (210) + Opening Cash 560 = Closing Cash 350 (114) (77) 12 (65) 10 (104) (1) 1 (31) (27) (125) (34) (55) (123) (211) (29) 350 321 (182) (15) 306 $2.15 600 $2.03 512 Ordinary Share price (31 December) Number of ordinary shares (thousands) Preference Share price (31 December) Number of preference shares (thousands) $2.17 469 $1.35 162 $1.33 162 $1.26 162 2019 2020 2021 Industry Averages 30. 0% 11. 7% 14. 0% 42. 1% 63.0 32.9 31.1 79. 1% Calculate the following ratio for each of the last 3 years Profitability Ratios 1. Return on Equity (Percentage to 1 decimal place) 2. Return on Capital Employed (Percentage to 1 decimal place) 3. Operating Profit Margin (Percentage to 1 decimal place) 4. Gross Profit Margin (Percentage to 1 decimal place) Efficiency Ratios 5. Average Inventory Turnover Period {No. of days to 1 decimal place) 6. Average Settlement Period for Accounts Receivab] {No. of days to 1 decimal place) 7. Average Settlement Period for Accounts Payable (No. of days to 1 decimal place) 8. Sales Revenue to Capital Employed (Percentage to 1 decimal place) Liquidity Ratios 9. Current Ratio decimal value to 2 decimal places) 10. Acid Test Ratio decimal value to 2 decimal places) Leverage Ratios 11. Gearing Ratio (Percentage to 1 decimal place) 12. Interest Cover Ratio Jecimal value to 2 decimal places) Investment Ratios 13. Dividend Payout Ratio (Percentage to 1 decimal place) 14. Dividend Yield (Percentage to 2 decimal places) 15. Earnings Per Share (Round to the nearest cent) 16. P/E Ratio* (Decimal value to 1 decimal place) *(use the EPS rounded to the nearest cent in doing this calculation) 3. 43 2.06 58. 9% 4.53 40. 7% 4. 32% $0.21 1


