

Answered step by step
Verified Expert Solution
Question
1 Approved Answer
BARRY'S SUPERSTORE Comparative Year-End Income Statements BARRY'S SUPERSTORE Comparative Year-End Balance Sheets Prior Year Current Year Prior Year Current Year Net Sales Cost of Goods
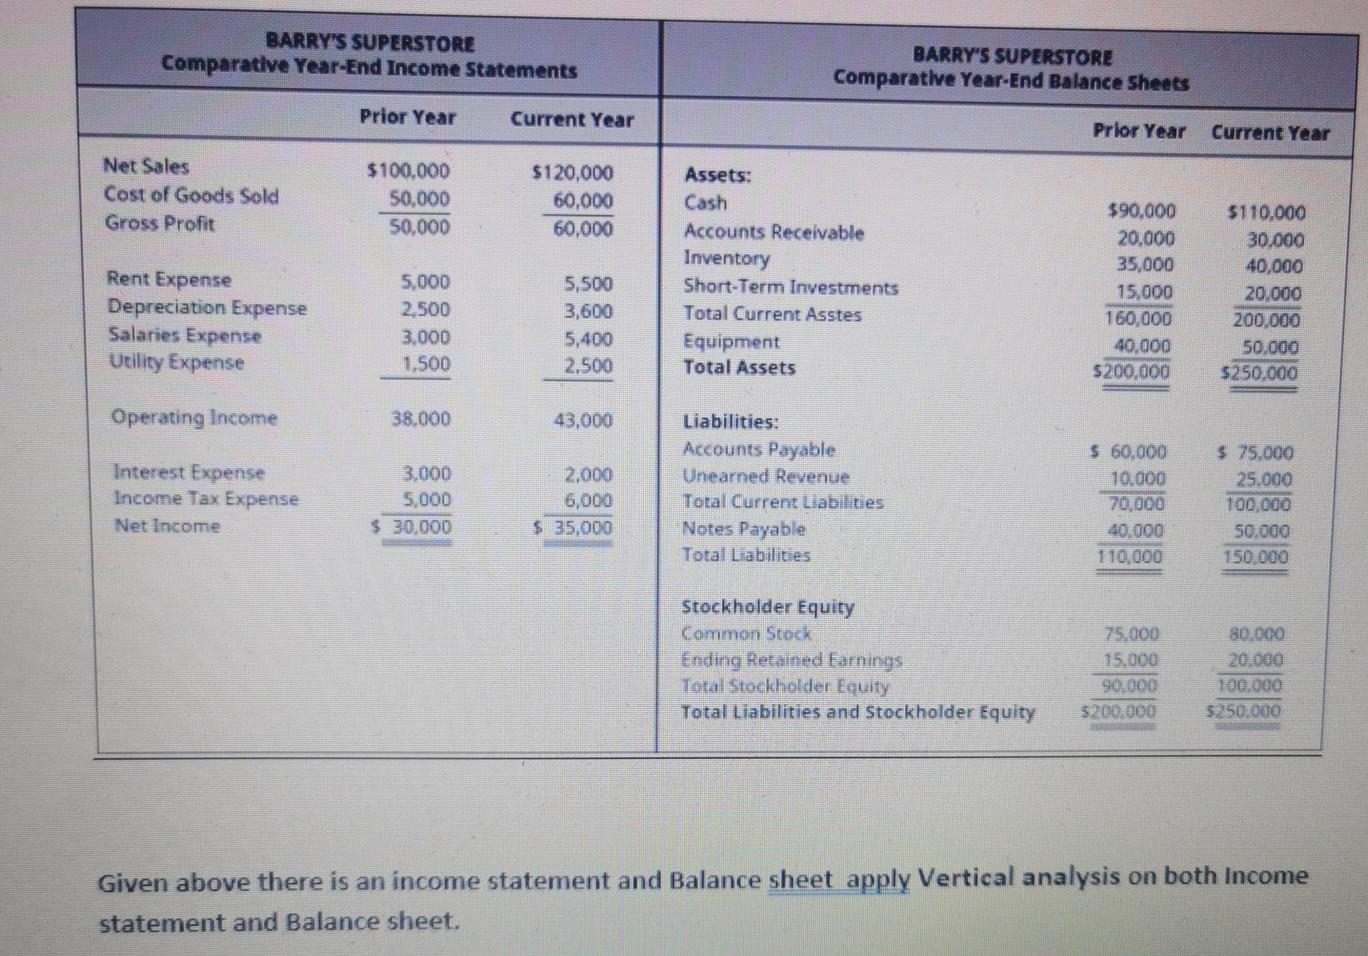
BARRY'S SUPERSTORE Comparative Year-End Income Statements BARRY'S SUPERSTORE Comparative Year-End Balance Sheets Prior Year Current Year Prior Year Current Year Net Sales Cost of Goods Sold Gross Profit $100,000 50,000 50.000 $120,000 60,000 60,000 Rent Expense Depreciation Expense Salaries Expense Utility Expense Assets: Cash Accounts Receivable Inventory Short-Term Investments Total Current Asstes Equipment Total Assets 5.000 2.500 3.000 1,500 5,500 3,600 5,400 2.500 $90,000 20.000 35,000 15,000 160,000 40.000 $200,000 $110.000 30.000 40,000 20.000 200.000 50.000 $250.000 Operating Income 38.000 43,000 Interest Expense Income Tax Expense Net Income 3.000 5,000 30.000 2,000 6,000 $ 35,000 Liabilities: Accounts Payable Unearned Revenue Total Current Liabilities Notes Payable Total Liabilities $ 60,000 10.000 70.000 40.000 110,000 $ 75.000 25.000 100,000 50.000 150.000 Stockholder Equity Common Stock Ending Retained Earnings Total Stockholder Equity Total Liabilities and Stockholder Equity 75.000 15.000 90.000 $200,000 80.000 20.000 100.000 $750,000 Given above there is an income statement and Balance sheet apply Vertical analysis on both Income statement and Balance sheet
Step by Step Solution
There are 3 Steps involved in it
Step: 1

Get Instant Access to Expert-Tailored Solutions
See step-by-step solutions with expert insights and AI powered tools for academic success
Step: 2

Step: 3
Ace Your Homework with AI
Get the answers you need in no time with our AI-driven, step-by-step assistance
Get Started
Easyinvoice Invoice Billing Receiption Accounting Make It Easy
Authors: Thian Thima
B0C87W2HNB