

Question
Base on 3 picture in the attachment. Answer the following question: 1 a, Find the sample size ( n ) for your dataset. b, Find
Base on 3 picture in the attachment. Answer the following question:
1
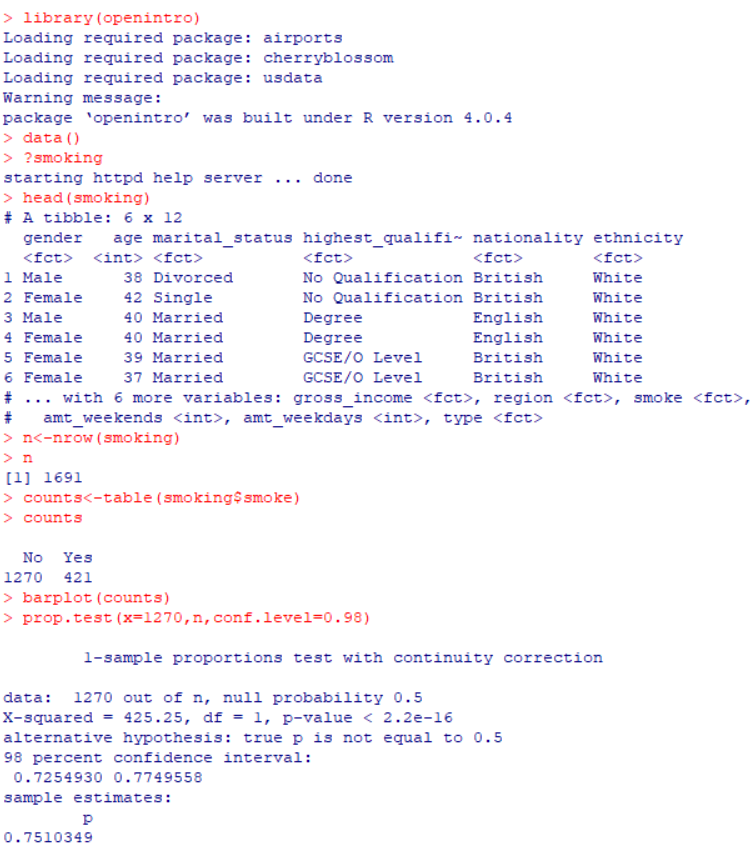
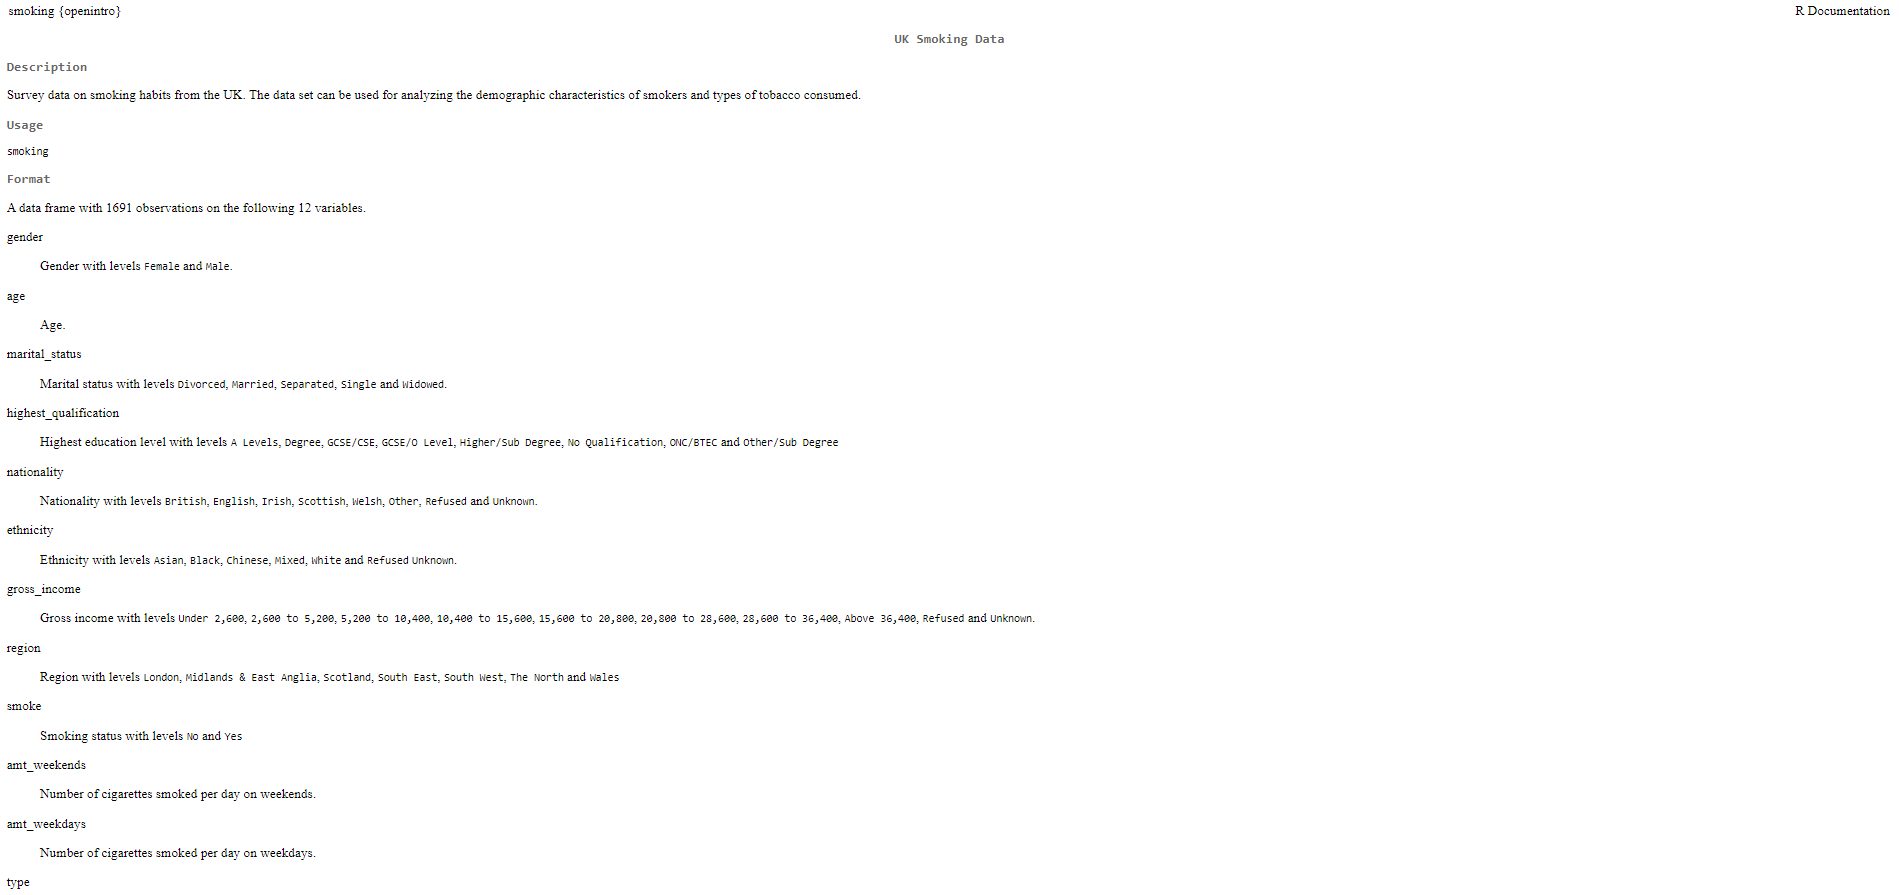
a, Find the sample size (n) for your dataset.
b, Find the counts for your categorical variable.
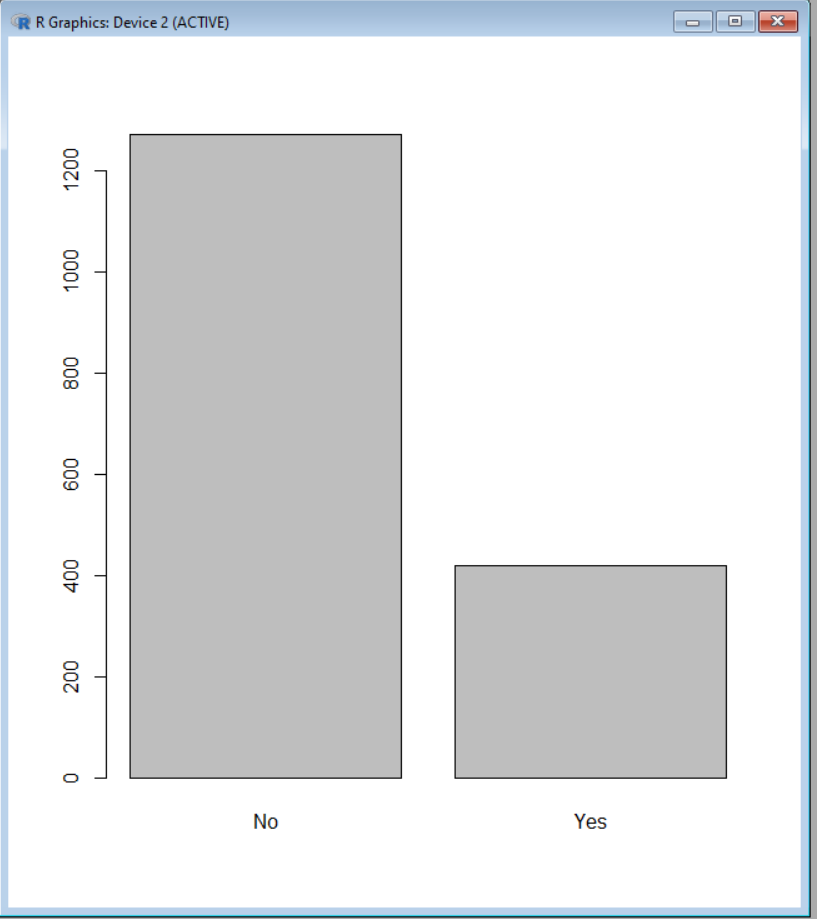
c, Graph a bar plot with the counts for your categorical variable.
d, Define the "success" (outcome you are interested in)for your categorical variable.
e, Identify your parameter of interest(in context) for this dataset.
f, Identifythe numberof successes (x) for your data.
g, Identify your point estimate in both words and numbers.
h, Verify the conditions for applying the CLT (Central Limit Theorem): independence (Is it a random sample?) and sample size (Are there at least 10 successes and 10 failures?).For independence, check any information on your data set with the "?yourdatasetname" R command. If the conditions are not met or the information is not provided to make this decision, note the possible issues but proceed with finding the confidence interval.
i, Calculate the98% Confidence Interval for your parameter of interest using the sample proportion of successes from the dataset.
j, State the correct interpretation of the confidence interval in wordsin the context of the problem.
Step by Step Solution
There are 3 Steps involved in it
Step: 1

Get Instant Access to Expert-Tailored Solutions
See step-by-step solutions with expert insights and AI powered tools for academic success
Step: 2

Step: 3
Ace Your Homework with AI
Get the answers you need in no time with our AI-driven, step-by-step assistance
Get Started
Algebra And Trigonometry Enhanced With Graphing Utilities (Subscription)
Authors: Michael, Michael Sullivan III, Michael III Sullivan, Michael Sullivan 111, III Sullivan
6th Edition
0321849132, 9780321849137