 based on 2 information, help me with CVP.
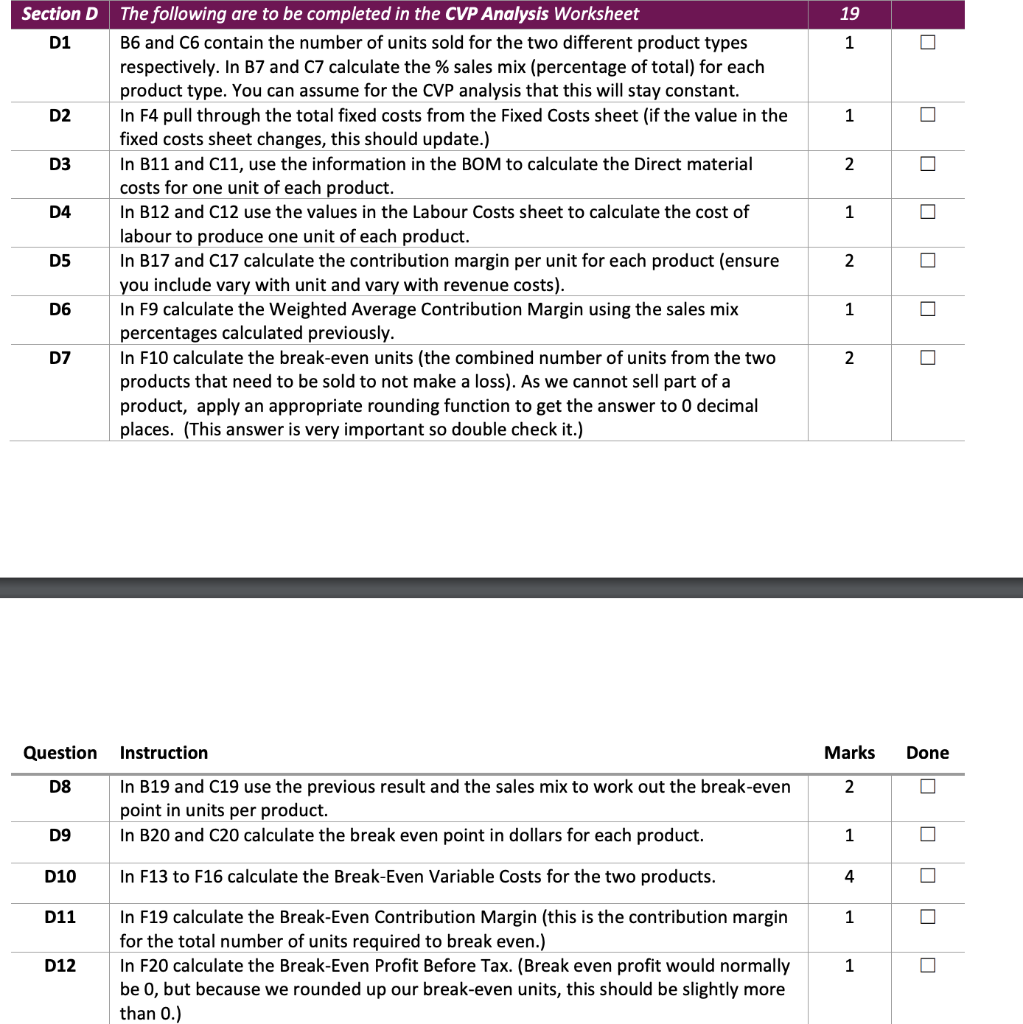
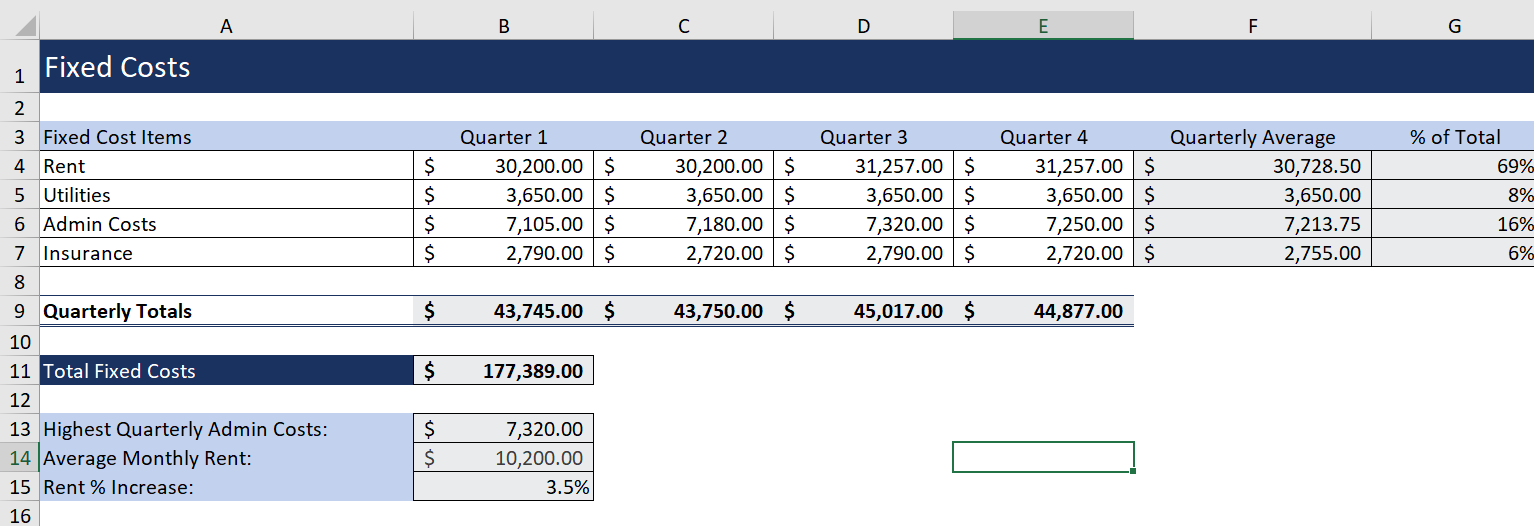
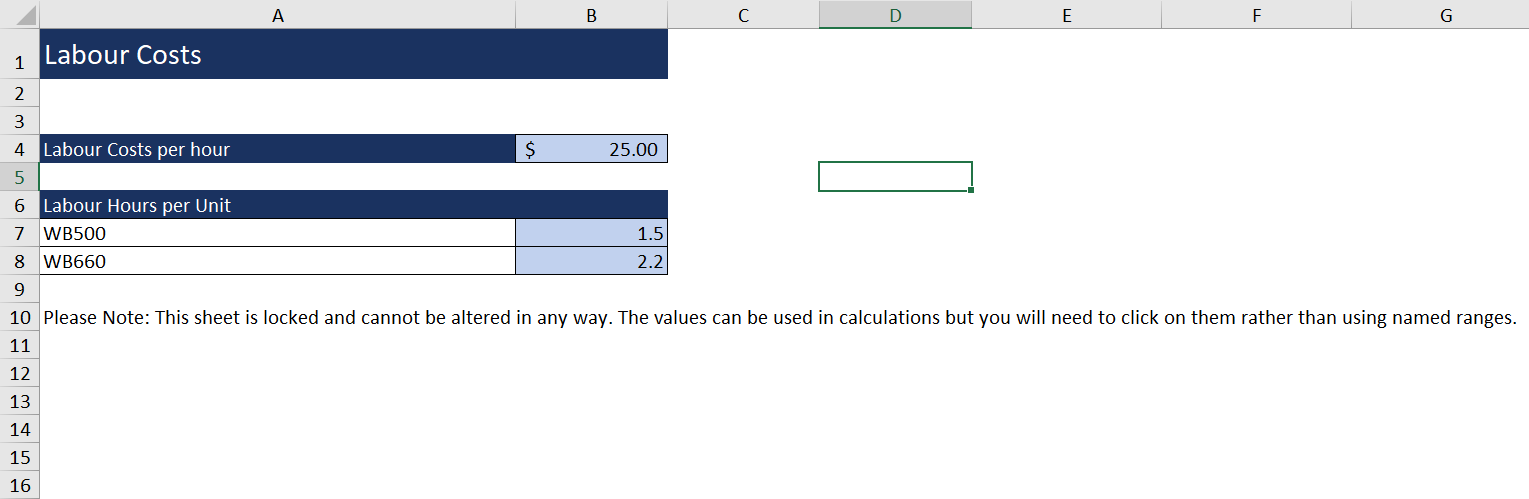
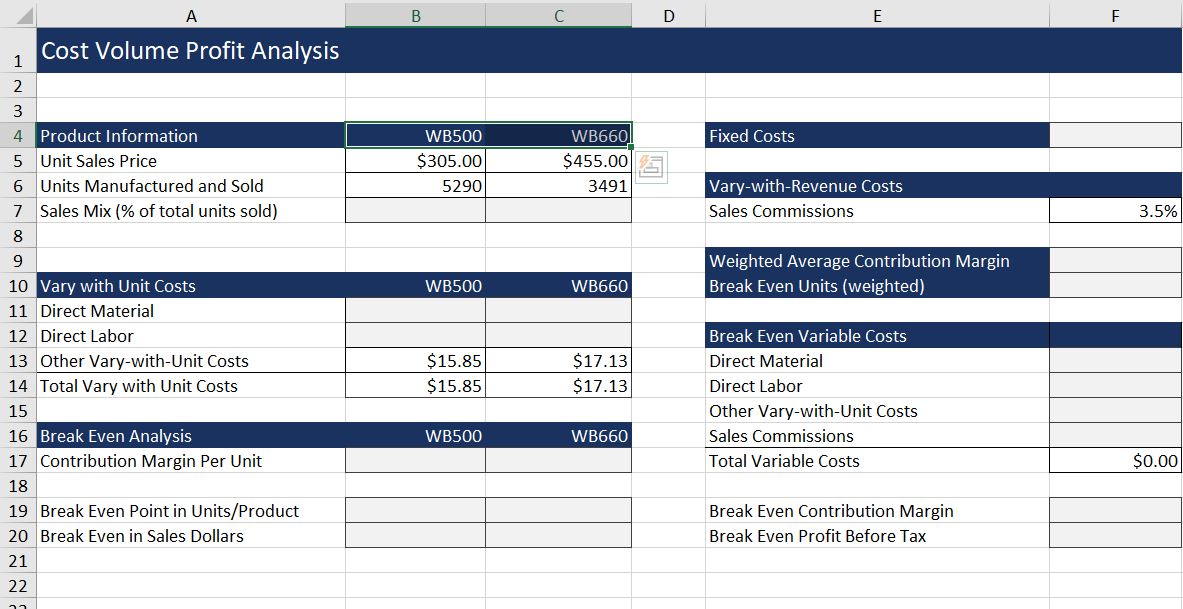
A B D E F G Fixed Costs 1 $ $ $ $ Quarter 1 30,200.00 $ 3,650.00 $ 7,105.00 $ 2,790.00 $ Quarter 2 30,200.00 $ 3,650.00 $ 7,180.00 $ 2,720.00 $ Quarter 3 31,257.00 $ 3,650.00 $ 7,320.00 $ 2,790.00 $ Quarter 4 31,257.00 $ 3,650.00 $ 7,250.00 $ 2,720.00 $ Quarterly Average 30,728.50 3,650.00 7,213.75 2,755.00 % of Total 69% 8% 16% 6% 2 3 Fixed Cost Items 4 Rent 5 Utilities 6 Admin Costs 7 Insurance 8 9 Quarterly Totals 10 11 Total Fixed Costs 12 13 Highest Quarterly Admin Costs: 14 Average Monthly Rent: 15 Rent % Increase: 16 $ 43,745.00 $ 43,750.00 $ 45,017.00 $ 44,877.00 $ 177,389.00 $ $ 7,320.00 10,200.00 3.5% A B D E F G 1 Labour Costs 2 3 4 Labour Costs per hour $ 25.00 5 6 Labour Hours per Unit 7 WB500 1.5 8 WB660 2.2 9 10 Please Note: This sheet is locked and cannot be altered in any way. The values can be used in calculations but you will need to click on them rather than using named ranges. 11 12 13 14 15 16 B D E F Cost Volume Profit Analysis 1 Fixed Costs NM + DONO WB500 $305.00 5290 WB6608 $455.00 3491 Vary-with-Revenue Costs Sales Commissions 3.5% Weighted Average Contribution Margin Break Even Units (weighted) WB500 WB660 3 4. Product Information 5 Unit Sales Price 6 Units Manufactured and Sold 7 Sales Mix (% of total units sold) 8 9 10 Vary with Unit Costs 11 Direct Material 12 Direct Labor 13 Other Vary-with-Unit Costs 14 Total Vary with Unit Costs 15 16 Break Even Analysis 17 Contribution Margin Per Unit 18 19 Break Even Point in Units/Product 20 Break Even in Sales Dollars 21 22 $15.85 $15.85 $17.13 $17.13 Break Even Variable Costs Direct Material Direct Labor Other Vary-with-Unit Costs Sales Commissions Total Variable Costs WB500 WB660 $0.00 Break Even Contribution Margin Break Even Profit Before Tax 19 Section D D1 1 D2 1 D3 2 D4 1 The following are to be completed in the CVP Analysis Worksheet B6 and C6 contain the number of units sold for the two different product types respectively. In B7 and C7 calculate the % sales mix (percentage of total) for each product type. You can assume for the CVP analysis that this will stay constant. In F4 pull through the total fixed costs from the Fixed Costs sheet (if the value in the fixed costs sheet changes, this should update.) In B11 and C11, use the information in the BOM to calculate the Direct material costs for one unit of each product. In B12 and C12 use the values in the Labour Costs sheet to calculate the cost of labour to produce one unit of each product. In B17 and C17 calculate the contribution margin per unit for each product (ensure you include vary with unit and vary with revenue costs). In F9 calculate the Weighted Average Contribution Margin using the sales mix percentages calculated previously. In F10 calculate the break-even units (the combined number of units from the two products that need to be sold to not make a loss). As we cannot sell part of a product, apply an appropriate rounding function to get the answer to 0 decimal places. (This answer is very important so double check it.) D5 2 D6 1 D7 2 Question Instruction Marks Done D8 2 In B19 and C19 use the previous result and the sales mix to work out the break-even point in units per product. In B20 and C20 calculate the break even point in dollars for each product. D9 1 D10 In F13 to F16 calculate the Break-Even Variable Costs for the two products. 4 D11 1 D12 In F19 calculate the Break-Even Contribution Margin (this is the contribution margin for the total number of units required to break even.) In F20 calculate the Break-Even Profit Before Tax. (Break even profit would normally be 0, but because we rounded up our break-even units, this should be slightly more than 0.) 1 A B D E F G Fixed Costs 1 $ $ $ $ Quarter 1 30,200.00 $ 3,650.00 $ 7,105.00 $ 2,790.00 $ Quarter 2 30,200.00 $ 3,650.00 $ 7,180.00 $ 2,720.00 $ Quarter 3 31,257.00 $ 3,650.00 $ 7,320.00 $ 2,790.00 $ Quarter 4 31,257.00 $ 3,650.00 $ 7,250.00 $ 2,720.00 $ Quarterly Average 30,728.50 3,650.00 7,213.75 2,755.00 % of Total 69% 8% 16% 6% 2 3 Fixed Cost Items 4 Rent 5 Utilities 6 Admin Costs 7 Insurance 8 9 Quarterly Totals 10 11 Total Fixed Costs 12 13 Highest Quarterly Admin Costs: 14 Average Monthly Rent: 15 Rent % Increase: 16 $ 43,745.00 $ 43,750.00 $ 45,017.00 $ 44,877.00 $ 177,389.00 $ $ 7,320.00 10,200.00 3.5% A B D E F G 1 Labour Costs 2 3 4 Labour Costs per hour $ 25.00 5 6 Labour Hours per Unit 7 WB500 1.5 8 WB660 2.2 9 10 Please Note: This sheet is locked and cannot be altered in any way. The values can be used in calculations but you will need to click on them rather than using named ranges. 11 12 13 14 15 16 B D E F Cost Volume Profit Analysis 1 Fixed Costs NM + DONO WB500 $305.00 5290 WB6608 $455.00 3491 Vary-with-Revenue Costs Sales Commissions 3.5% Weighted Average Contribution Margin Break Even Units (weighted) WB500 WB660 3 4. Product Information 5 Unit Sales Price 6 Units Manufactured and Sold 7 Sales Mix (% of total units sold) 8 9 10 Vary with Unit Costs 11 Direct Material 12 Direct Labor 13 Other Vary-with-Unit Costs 14 Total Vary with Unit Costs 15 16 Break Even Analysis 17 Contribution Margin Per Unit 18 19 Break Even Point in Units/Product 20 Break Even in Sales Dollars 21 22 $15.85 $15.85 $17.13 $17.13 Break Even Variable Costs Direct Material Direct Labor Other Vary-with-Unit Costs Sales Commissions Total Variable Costs WB500 WB660 $0.00 Break Even Contribution Margin Break Even Profit Before Tax 19 Section D D1 1 D2 1 D3 2 D4 1 The following are to be completed in the CVP Analysis Worksheet B6 and C6 contain the number of units sold for the two different product types respectively. In B7 and C7 calculate the % sales mix (percentage of total) for each product type. You can assume for the CVP analysis that this will stay constant. In F4 pull through the total fixed costs from the Fixed Costs sheet (if the value in the fixed costs sheet changes, this should update.) In B11 and C11, use the information in the BOM to calculate the Direct material costs for one unit of each product. In B12 and C12 use the values in the Labour Costs sheet to calculate the cost of labour to produce one unit of each product. In B17 and C17 calculate the contribution margin per unit for each product (ensure you include vary with unit and vary with revenue costs). In F9 calculate the Weighted Average Contribution Margin using the sales mix percentages calculated previously. In F10 calculate the break-even units (the combined number of units from the two products that need to be sold to not make a loss). As we cannot sell part of a product, apply an appropriate rounding function to get the answer to 0 decimal places. (This answer is very important so double check it.) D5 2 D6 1 D7 2 Question Instruction Marks Done D8 2 In B19 and C19 use the previous result and the sales mix to work out the break-even point in units per product. In B20 and C20 calculate the break even point in dollars for each product. D9 1 D10 In F13 to F16 calculate the Break-Even Variable Costs for the two products. 4 D11 1 D12 In F19 calculate the Break-Even Contribution Margin (this is the contribution margin for the total number of units required to break even.) In F20 calculate the Break-Even Profit Before Tax. (Break even profit would normally be 0, but because we rounded up our break-even units, this should be slightly more than 0.) 1