

Answered step by step
Verified Expert Solution
Question
1 Approved Answer
Based on the above spreadsheet, find or calculate the NPV, IRR, BCR, Payback Period, and Discounted Payback Period where applicable. 2 Note: Using 14% required
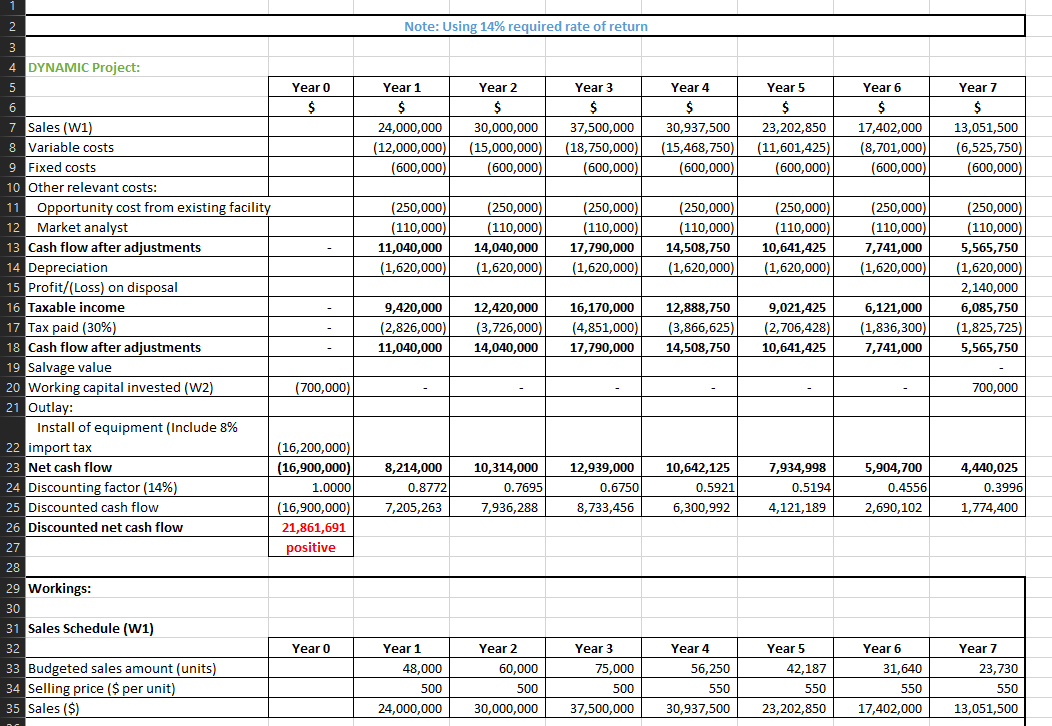
Based on the above spreadsheet, find or calculate the NPV, IRR, BCR, Payback Period, and Discounted Payback Period where applicable.
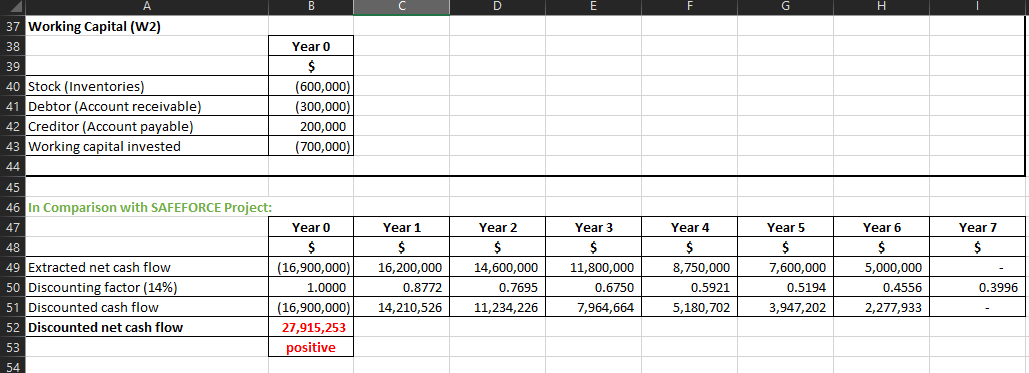
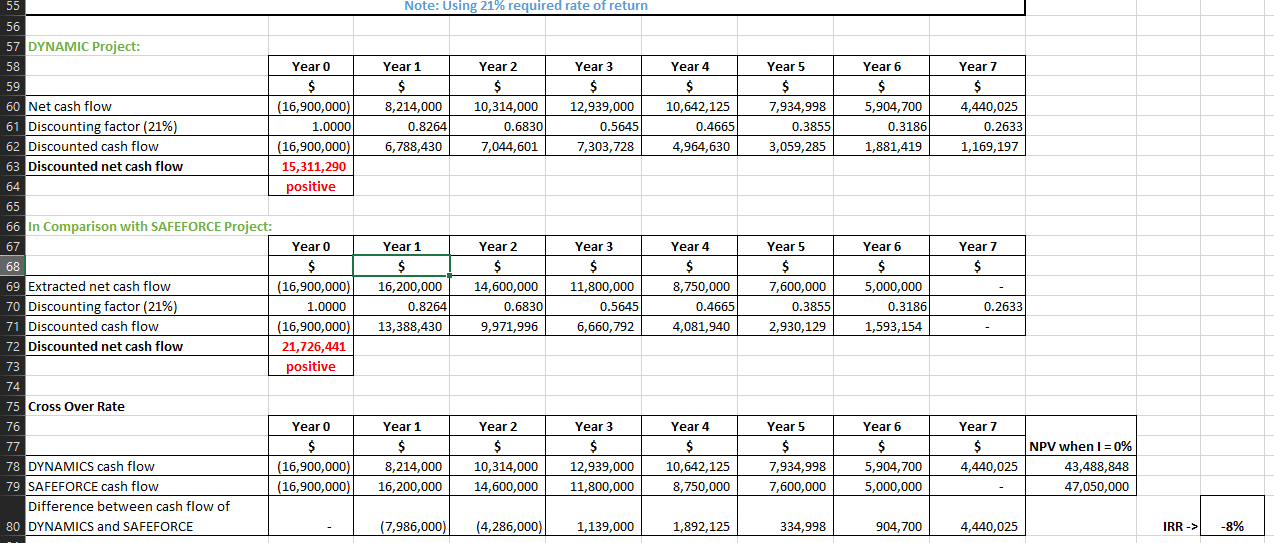
2 Note: Using 14% required rate of return Year 1 $ 24,000,000 (12,000,000) (600,000) Year 2 $ 30,000,000 (15,000,000) (600,000) Year 3 $ 37,500,000 (18,750,000) (600,000) Year 4 $ 30,937,500 (15,468,750) (600,000) Year 5 $ 23,202,850 (11,601,425) (600,000) Year 6 $ 17,402,000 (8,701,000) (600,000) Year 7 $ 13,051,500 (6,525,750) (600,000) (250,000) (110,000) 11,040,000 (1,620,000) (250,000) (110,000) 14,040,000 (1,620,000) (250,000) (110,000) 17,790,000 (1,620,000) (250,000) (110,000) 14,508,750 (1,620,000) (250,000) (110,000) 10,641,425 (1,620,000) (250,000) (110,000) 7,741,000 (1,620,000 4 DYNAMIC Project: 5 Year 0 6 $ 7 Sales (1) 8 Variable costs 9 Fixed costs 10 Other relevant costs: 11 Opportunity cost from existing facility 12 Market analyst 13 Cash flow after adjustments 14 Depreciation 15 Profit/(Loss) on disposal 16 Taxable income 17 Tax paid (30%) 18 Cash flow after adjustments 19 Salvage value 20 Working capital invested (W2) (700,000) 21 Outlay: Install of equipment (Include 8% 22 import tax (16,200,000) 23 Net cash flow (16,900,000) 24 Discounting factor (14%) 1.0000 25 Discounted cash flow (16,900,000) 26 Discounted net cash flow 21,861,691 27 positive (250,000) (110,000) 5,565,750 (1,620,000 2,140,000 6,085,750 (1,825,725) 5,565,750 9,420,000 (2,826,000) 11,040,000 12,420,000 (3,726,000) 14,040,000 16,170,000 (4,851,000) 17,790,000 12,888,750 (3,866,625) 14,508,750 9,021,425 (2,706,428) 10,641,425 6,121,000 (1,836,300) 7,741,000 700,000 8,214,000 0.8772 7,205,263 10,314,000 0.7695 7,936,288 12,939,000 0.6750 8,733,456 10,642,125 0.5921 6,300,992 7,934,998 0.5194 4,121,189 5,904,700 0.4556 2,690,102 4,440,025 0.3996 1,774,400 28 29 Workings: 30 31 Sales Schedule (W1) 32 33 Budgeted sales amount (units) 34 Selling price ($ per unit) 35 Sales ($) Year 0 Year 1 48,000 500 24,000,000 Year 2 60,000 500 30,000,000 Year 3 75,000 500 37,500,000 Year 4 56,250 550 30,937,500 Year 5 42,187 550 23,202,850 Year 6 31,640 550 17,402,000 Year 7 23,730 550 13,051,500 B D E G H A 37 Working Capital (2) 38 39 40 Stock (Inventories) 41 Debtor (Account receivable) 42 Creditor (Account payable) 43 Working capital invested 44 Year 0 $ (600,000) (300,000) 200,000 (700,000) Year 7 $ 45 46 In Comparison with SAFEFORCE Project: 47 Year 0 48 $ 49 Extracted net cash flow (16,900,000) 50 Discounting factor (14%) 1.0000 51 Discounted cash flow (16,900,000) 52 Discounted net cash flow 27,915,253 53 positive 54 Year 1 $ 16,200,000 0.8772 14,210,526 Year 2 $ 14,600,000 0.7695 11,234,226 Year 3 $ 11,800,000 0.6750 7,964,664 Year 4 $ 8,750,000 0.5921 5,180,702 Year 5 $ 7,600,000 0.5194 3,947,202 Year 6 $ 5,000,000 0.4556 2,277,933 0.3996 55 Note: Using 21% required rate of return Year 1 $ 8,214,000 0.8264 6,788,430 Year 2 $ 10,314,000 0.6830 7,044,601 Year 3 $ 12,939,000 0.5645 7,303,728 Year 4 $ 10,642,125 0.4665 4,964,630 Year 5 $ 7,934,998 0.3855 3,059,285 Year 6 $ 5,904,700 0.3186 1,881,419 Year 7 $ 4,440,025 0.2633 1,169,197 Year? Year 7 $ 56 57 DYNAMIC Project: 58 Year 0 59 $ 60 Net cash flow (16,900,000) 61 Discounting factor (21%) 1.0000 62 Discounted cash flow (16,900,000) 63 Discounted net cash flow 15,311,290 64 positive 65 66 In Comparison with SAFEFORCE Project: 67 Year 0 68 $ 69 Extracted net cash flow (16,900,000) 70 Discounting factor (21%) 1.0000 71 Discounted cash flow (16,900,000) 72 Discounted net cash flow 21,726,441 73 positive 74 75 Cross Over Rate 76 Year 0 77 $ 78 DYNAMICS cash flow (16,900,000) 79 SAFEFORCE cash flow (16,900,000) Difference between cash flow of 80 DYNAMICS and SAFEFORCE Year 1 $ 16,200,000 0.8264 13,388,430 Year 2 $ 14,600,000 0.6830 9,971,996 Year 3 $ 11,800,000 0.5645 6,660,792 Year 4 $ 8,750,000 0.4665 4,081,940 Year 5 $ 7,600,000 0.3855 2,930,129 Year 6 $ 5,000,000 0.3186 1,593,154 0.2633 Year 1 $ 8,214,000 16,200,000 Year 2 $ 10,314,000 14,600,000 Year 3 $ 12,939,000 11,800,000 Year 4 $ 10,642,125 8,750,000 Year 5 $ 7,934,998 7,600,000 Year 6 $ 5,904,700 5,000,000 Year 7 $ 4,440,025 NPV when I = 0% 43,488,848 47,050,000 (7,986,000) (4,286,000) 1,139,000 1,892,125 334,998 904,700 4,440,025 IRR -> -8%Step by Step Solution
There are 3 Steps involved in it
Step: 1

Get Instant Access to Expert-Tailored Solutions
See step-by-step solutions with expert insights and AI powered tools for academic success
Step: 2

Step: 3
Ace Your Homework with AI
Get the answers you need in no time with our AI-driven, step-by-step assistance
Get Started
Mission Ready Finances Proven Principles To Guide Your Story To Financial Freedom
Authors: Marco Parzych
1st Edition
173321531X, 978-1733215312