-
Based on the background knowledge about the Ford Motor and auto industry given in the case, are the overall economic conditions positive or negative to the auto business of Ford? Please list evidence by bullet points to support your opinion.
-
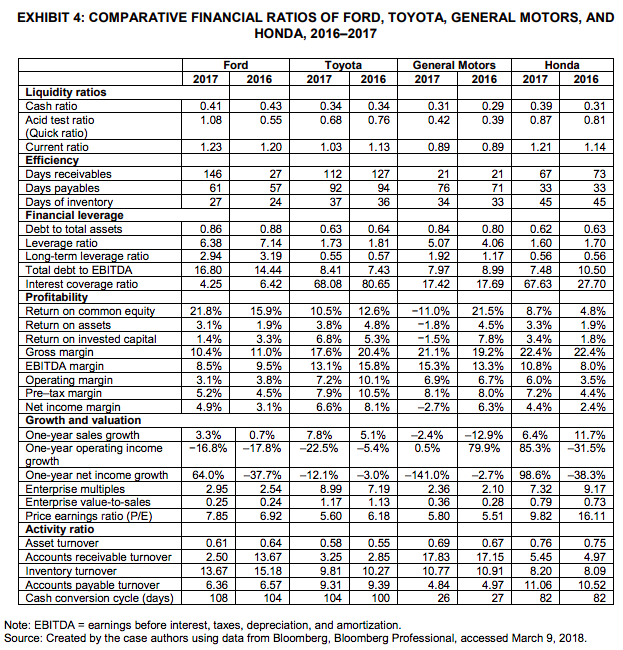
Compare the financial ratios of Ford to other three firms, and describe Fords comparative performance and financial position. Write down your analysis for each categoryliquidity ratios, financial leverage ratios, turnover ratios (efficiency ratios and activity ratios as given in Exhibit 4), profitability ratios, and growth and valuation ratios.
-
Based on your answer to question 2, where are Fords major strengths and weaknesses?
-
Based on your analyses so far, as John Smith in January 2018, would you buy more Ford stock, continue to hold Ford stock, or sell the Ford stock and invest in other auto stocks? Why? Please list your reasons to support your decision. 
EXHIBIT 4: COMPARATIVE FINANCIAL RATIOS OF FORD, TOYOTA, GENERAL MOTORS, AND HONDA, 2016-2017 Ford 2016 2017 Toyota 2017 2016 General Motors 2017 2016 Honda 2017 2016 0.39 0.41 1.08 0.43 0.55 0.34 0.68 0.34 0.76 0.31 0.42 0.29 0.39 0.31 0.81 0.87 1.23 1.20 1.03 1.13 0.89 0.89 1.21 1.14 146 61 27 2 7 57 24 1 12 92 37 127 94 36 21 76 34 21 71 33 67 33 45 73 33 45 0.86 6.38 2.94 16.80 4.25 0.88 7.14 3.19 14.44 6.42 0.63 1.73 0.55 8.41 68.08 0.64 1.81 0.57 7.43 80.65 0.84 5.07 1.92 7.97 17.42 0.80 4.06 1.17 .99 17.69 0.62 1.60 0.56 7.48 67.63 0.63 1.70 0.56 10.50 27.70 8 Liquidity ratios Cash ratio Acid test ratio (Quick ratio) Current ratio Efficiency Days receivables Days payables Days of inventory Financial leverage Debt to total assets Leverage ratio Long-term leverage ratio Total debt to EBITDA Interest coverage ratio Profitability Return on common equity Return on assets Return on invested capital Gross margin EBITDA margin Operating margin Pre-tax margin Net income margin Growth and valuation One-year sales growth One-year operating income growth One-year net income growth Enterprise multiples Enterprise value-to-sales Price earnings ratio (P/E) Activity ratio Asset turnover Accounts receivable turnover Inventory turnover Accounts payable turnover Cash conversion cycle (days) 21.8% 3.1% 1.4% 10.4% 8.5% 3.1% 5.2% 4.9% 15.9% 1.9% 3.3% 11.0% 9.5% 3.8% 4.5% 3.1% 10.5% 3.8% 6.8% 17.6% 13.1% 7.2% 7.9% 6.6% 12.6% 4.8% 5.3% 20.4% 15.8% 10.1% 10.5% 8.1% -11.0% -1.8% -1.5% 21.1% 15.3% 6.9% 8.1% -2.7% 21.5% 4.5% 7.8% 19.2% 13.3% 6.7% 8.0% 6.3% 8.7% 3.3% 3.4% 22.4% 10.8% 6.0% 7.2% 4.4% 4.8% 1.9% 1.8% 22.4% 8.0% 3.5% 4.4% 2.4% -12.9% 6.4% 11.7% 3.3% -16.8% 0.7% -17.8% 7.8% -22.5% 5.1% -5.4% -2.4% 0.5% 64.0% 2.95 0.25 7.85 -37.7% 2.54 0.24 6.92 -12.1% 8.99 1.17 5.60 -3.0% 7.19 1.13 6.18 -141.0% 2.36 0.36 5.80 -2.7% 2.10 0.28 5.51 98.6% 7.32 0.79 9.82 -38.3% 9.17 0.73 16.11 0.61 2.50 13.67 6.36 | 108 0.64 13.67 15.18 6.57 104 0.58 3.25 9.81 9.31 | 104 0.55 2.85 10.27 9.39| 100 0.69 17.83 10.77 4.84 26 0.67 17.15 10.91 4.97 27 0.76 0.75 5.45 4.97 8.20 8.09 11.06 10.52 8282 82 [ Note: EBITDA = earnings before interest, taxes, depreciation, and amortization. Source: Created by the case authors using data from Bloomberg, Bloomberg Professional, accessed March 9, 2018. EXHIBIT 4: COMPARATIVE FINANCIAL RATIOS OF FORD, TOYOTA, GENERAL MOTORS, AND HONDA, 2016-2017 Ford 2016 2017 Toyota 2017 2016 General Motors 2017 2016 Honda 2017 2016 0.39 0.41 1.08 0.43 0.55 0.34 0.68 0.34 0.76 0.31 0.42 0.29 0.39 0.31 0.81 0.87 1.23 1.20 1.03 1.13 0.89 0.89 1.21 1.14 146 61 27 2 7 57 24 1 12 92 37 127 94 36 21 76 34 21 71 33 67 33 45 73 33 45 0.86 6.38 2.94 16.80 4.25 0.88 7.14 3.19 14.44 6.42 0.63 1.73 0.55 8.41 68.08 0.64 1.81 0.57 7.43 80.65 0.84 5.07 1.92 7.97 17.42 0.80 4.06 1.17 .99 17.69 0.62 1.60 0.56 7.48 67.63 0.63 1.70 0.56 10.50 27.70 8 Liquidity ratios Cash ratio Acid test ratio (Quick ratio) Current ratio Efficiency Days receivables Days payables Days of inventory Financial leverage Debt to total assets Leverage ratio Long-term leverage ratio Total debt to EBITDA Interest coverage ratio Profitability Return on common equity Return on assets Return on invested capital Gross margin EBITDA margin Operating margin Pre-tax margin Net income margin Growth and valuation One-year sales growth One-year operating income growth One-year net income growth Enterprise multiples Enterprise value-to-sales Price earnings ratio (P/E) Activity ratio Asset turnover Accounts receivable turnover Inventory turnover Accounts payable turnover Cash conversion cycle (days) 21.8% 3.1% 1.4% 10.4% 8.5% 3.1% 5.2% 4.9% 15.9% 1.9% 3.3% 11.0% 9.5% 3.8% 4.5% 3.1% 10.5% 3.8% 6.8% 17.6% 13.1% 7.2% 7.9% 6.6% 12.6% 4.8% 5.3% 20.4% 15.8% 10.1% 10.5% 8.1% -11.0% -1.8% -1.5% 21.1% 15.3% 6.9% 8.1% -2.7% 21.5% 4.5% 7.8% 19.2% 13.3% 6.7% 8.0% 6.3% 8.7% 3.3% 3.4% 22.4% 10.8% 6.0% 7.2% 4.4% 4.8% 1.9% 1.8% 22.4% 8.0% 3.5% 4.4% 2.4% -12.9% 6.4% 11.7% 3.3% -16.8% 0.7% -17.8% 7.8% -22.5% 5.1% -5.4% -2.4% 0.5% 64.0% 2.95 0.25 7.85 -37.7% 2.54 0.24 6.92 -12.1% 8.99 1.17 5.60 -3.0% 7.19 1.13 6.18 -141.0% 2.36 0.36 5.80 -2.7% 2.10 0.28 5.51 98.6% 7.32 0.79 9.82 -38.3% 9.17 0.73 16.11 0.61 2.50 13.67 6.36 | 108 0.64 13.67 15.18 6.57 104 0.58 3.25 9.81 9.31 | 104 0.55 2.85 10.27 9.39| 100 0.69 17.83 10.77 4.84 26 0.67 17.15 10.91 4.97 27 0.76 0.75 5.45 4.97 8.20 8.09 11.06 10.52 8282 82 [ Note: EBITDA = earnings before interest, taxes, depreciation, and amortization. Source: Created by the case authors using data from Bloomberg, Bloomberg Professional, accessed March 9, 2018


