

Question
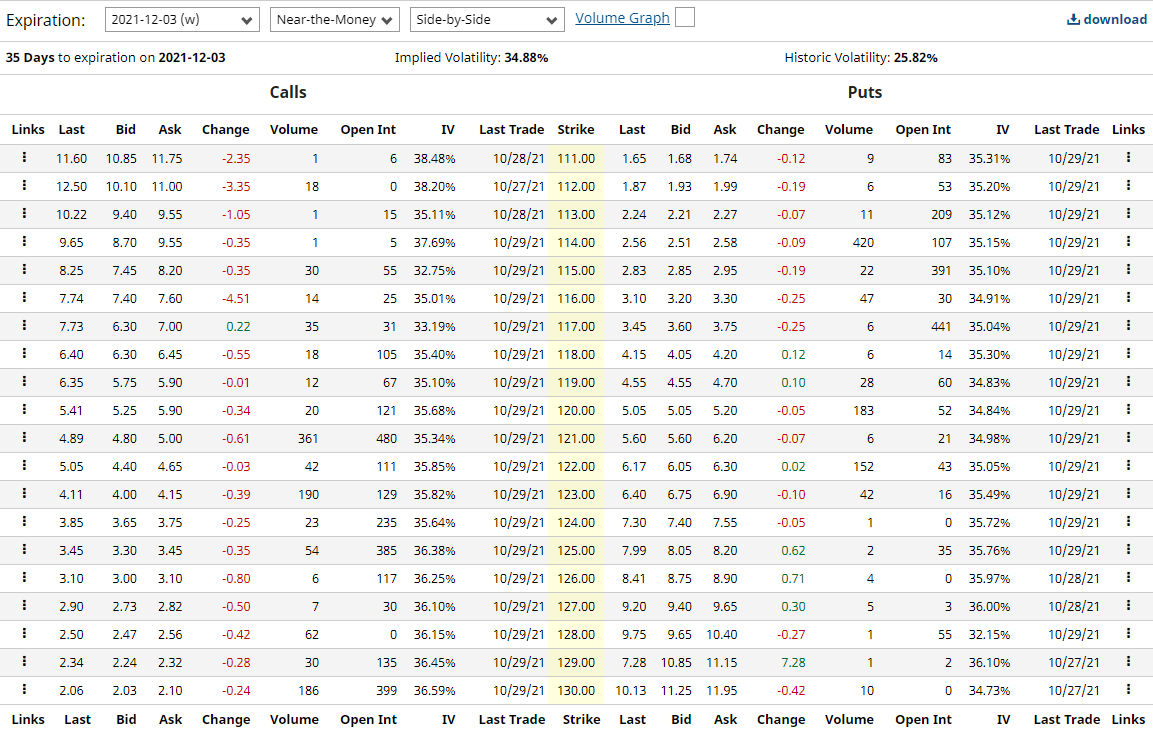
Based on the chart, Please fill in the chart by calculating Strike, Breakeven Point, Max Profit, and Max Loss for the Long Straddle (Include the
Based on the chart, Please fill in the chart by calculating Strike, Breakeven Point, Max Profit, and Max Loss for the Long Straddle (Include the math for your net premium PAID) (Please show work for calculation for each column)
Net Premium PAID:
Chart:
| Strike = ? | Breakeven Point | Max Profit | Max Loss |
| N/A | N/A |
Guidance:
You need to use the same strike for both the long call and the long put.
Expiration: 2021-12-03 (w) Near-the-Money Side-by-Side V Volume Graph download 35 Days to expiration on 2021-12-03 Implied Volatility: 34.88% Historic Volatility: 25.82% Calls Puts Links Last Bid Ask Change Volume Open Int IV Last Trade Strike Last Bid Ask Change Volume Open Int IV Last Trade Links 11.60 10.85 11.75 -2.35 1 6 38.48% 10/28/21 111.00 1.65 1.68 1.74 -0.12 9 83 35.31% 10/29/21 12.50 10.10 11.00 -3.35 18 0 38.20% 10/27/21 112.00 1.87 1.93 1.99 -0.19 6 53 35.20% 10/29/21 10.22 9.40 9.55 -1.05 1 15 35.11% % 10/28/21 113.00 2.24 2.21 2.27 -0.07 11 209 35.12% 10/29/21 9.65 8.70 9.55 -0.35 1 5 37.69% 10/29/21 114.00 2.56 2.51 2.58 -0.09 420 107 35.15% 10/29/21 8.25 7.45 8.20 -0.35 30 55 32.75% 10/29/21 115.00 2.83 2.85 2.95 -0.19 22 391 35.10% 10/29/21 7.74 7.40 7.60 -4.51 14 25 35.01% 10/29/21 116.00 3.10 3.20 3.30 -0.25 47 30 34.91% 10/29/21 7.73 6.30 7.00 0.22 35 31 33.19% 10/29/21 117.00 3.45 3.60 3.75 -0.25 6 441 35.04% 10/29/21 6.40 6.30 6.45 -0.55 18 105 35.40% 10/29/21 118.00 4.15 4.05 4.20 0.12 6 14 35.30% 10/29/21 6.35 5.75 5.90 -0.01 12 67 35.10% 10/29/21 119.00 4.55 4.55 4.70 0.10 28 60 34.83% 10/29/21 5.41 5.25 5.90 -0.34 20 121 35.68% 10/29/21 120.00 5.05 5.05 5.20 -0.05 183 52 34.84% 10/29/21 4.89 4.80 5.00 -0.61 361 480 35.34% 10/29/21 121.00 5.60 5.60 6.20 -0.07 6 21 34.98% 10/29/21 5.05 4.40 4.65 -0.03 42 111 35.85% 10/29/21 122.00 6.17 6.05 6.30 0.02 152 43 35.05% 10/29/21 4.11 4.00 4.15 -0.39 190 129 35.82% 10/29/21 123.00 6.40 6.75 6.90 -0.10 42 16 35.49% 10/29/21 3.85 3.65 3.75 -0.25 23 235 35.64% 10/29/21 124.00 7.30 7.40 7.55 -0.05 1 0 35.72% 10/29/21 : 3.45 3.30 3.45 -0.35 54 385 36.38% 10/29/21 125.00 7.99 8.05 8.20 0.62 2 35 35.76% 10/29/21 3.10 3.00 3.10 -0.80 6 117 36.25% 10/29/21 126.00 8.41 8.75 8.90 0.71 4 0 35.97% 10/28/21 2.90 2.73 2.82 -0.50 7 30 36.10% 10/29/21 127.00 9.20 9.40 9.65 0.30 5 3 36.00% 10/28/21 2.50 2.47 2.56 -0.42 62 0 36.15% 10/29/21 128.00 9.75 9.65 10.40 -0.27 1 55 32.15% 10/29/21 1 2.34 2.24 2.32 -0.28 30 135 36.45% 10/29/21 129.00 7.28 10.85 11.15 7.28 1 2 36.10% 10/27/21 2.06 2.03 2.10 -0.24 186 399 36.59% 10/29/21 130.00 10.13 11.25 11.95 -0.42 10 0 34.73% 10/27/21 1 Links Last Bid Ask Change Volume Open Int IV Last Trade Strike Last Bid Ask Change Volume Open Int IV Last Trade Links
Step by Step Solution
There are 3 Steps involved in it
Step: 1

Get Instant Access to Expert-Tailored Solutions
See step-by-step solutions with expert insights and AI powered tools for academic success
Step: 2

Step: 3
Ace Your Homework with AI
Get the answers you need in no time with our AI-driven, step-by-step assistance
Get Started
The Complete FinOps Handbook Essential Tools And Techniques For Financial Operations
Authors: Peter Bates
1st Edition
1922435546, 978-1922435545