Answered step by step
Verified Expert Solution
Question
1 Approved Answer
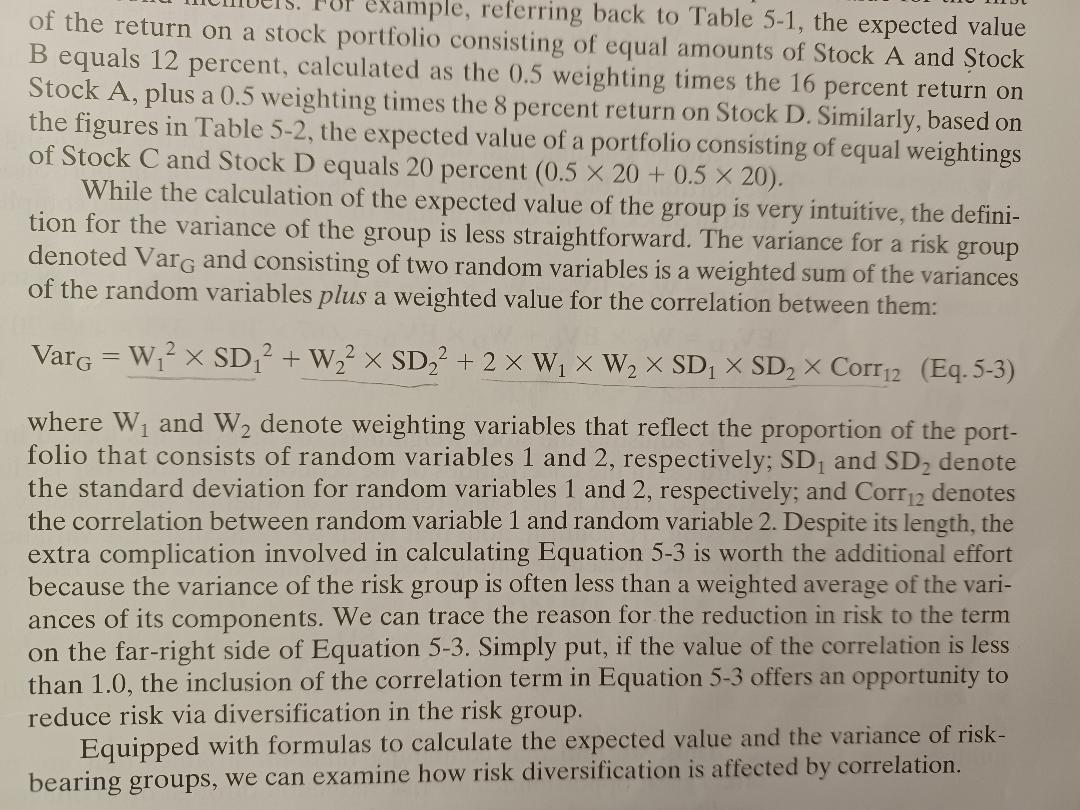
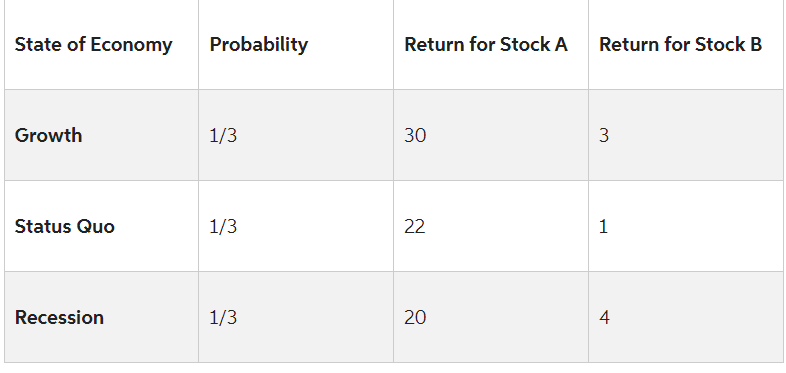
Based on the equation 5-3, describe the impact of including stock A and stock B in a stock portfolio on the portfolios risk. of the
Based on the equation 5-3, describe the impact of including stock A and stock B in a stock portfolio on the portfolios risk.

 of the return on a stock example, referring back to Table 5-1, the expected value B equals 12 percent, consisting of equal amounts of Stock A and Stock Stock A, plus a 0.5 , calculated as the 0.5 weighting times the 16 percent return on the figur the 8 percent return on Stock D. Similarly, based on of Stock C and Stock D equals 20 percent (0.520+0.520). While the calculation of the expected value of the group is very intuitive, the definition for the variance of the group is less straightforward. The variance for a risk group denoted VarG and consisting of two random variables is a weighted sum of the variances of the random variables plus a weighted value for the correlation between them: VarG=W12SD12+W22SD22+2W1W2SD1SD2Corr12 where W1 and W2 denote weighting variables that reflect the proportion of the portfolio that consists of random variables 1 and 2 , respectively; SD1 and SD2 denote the standard deviation for random variables 1 and 2 , respectively; and Corr 12 denotes the correlation between random variable 1 and random variable 2 . Despite its length, the extra complication involved in calculating Equation 5-3 is worth the additional effort because the variance of the risk group is often less than a weighted average of the variances of its components. We can trace the reason for the reduction in risk to the term on the far-right side of Equation 5-3. Simply put, if the value of the correlation is less than 1.0, the inclusion of the correlation term in Equation 5-3 offers an opportunity to reduce risk via diversification in the risk group. Equipped with formulas to calculate the expected value and the variance of riskbearing groups, we can examine how risk diversification is affected by correlation. \begin{tabular}{|l|l|l|l|} \hline State of Economy & Probability & Return for Stock A & Return for Stock B \\ \hline Growth & 1/3 & 30 & 3 \\ \hline Status Quo & 1/3 & 22 & 1 \\ \hline Recession & 1/3 & 20 & 4 \\ \hline \end{tabular}
 Step by Step Solution
There are 3 Steps involved in it
Step: 1

Get Instant Access to Expert-Tailored Solutions
See step-by-step solutions with expert insights and AI powered tools for academic success
Step: 2

Step: 3

Ace Your Homework with AI
Get the answers you need in no time with our AI-driven, step-by-step assistance
Get Started


