Based on the following financial data, balance sheet, income statement and stock performance graph of AT&T
1. What was the overall financial performance, including any notable changes from previous years. Make sure to address the companys profitability.
2. making a recommendation as to whether the audience should invest in the companys stock, and why or why not.
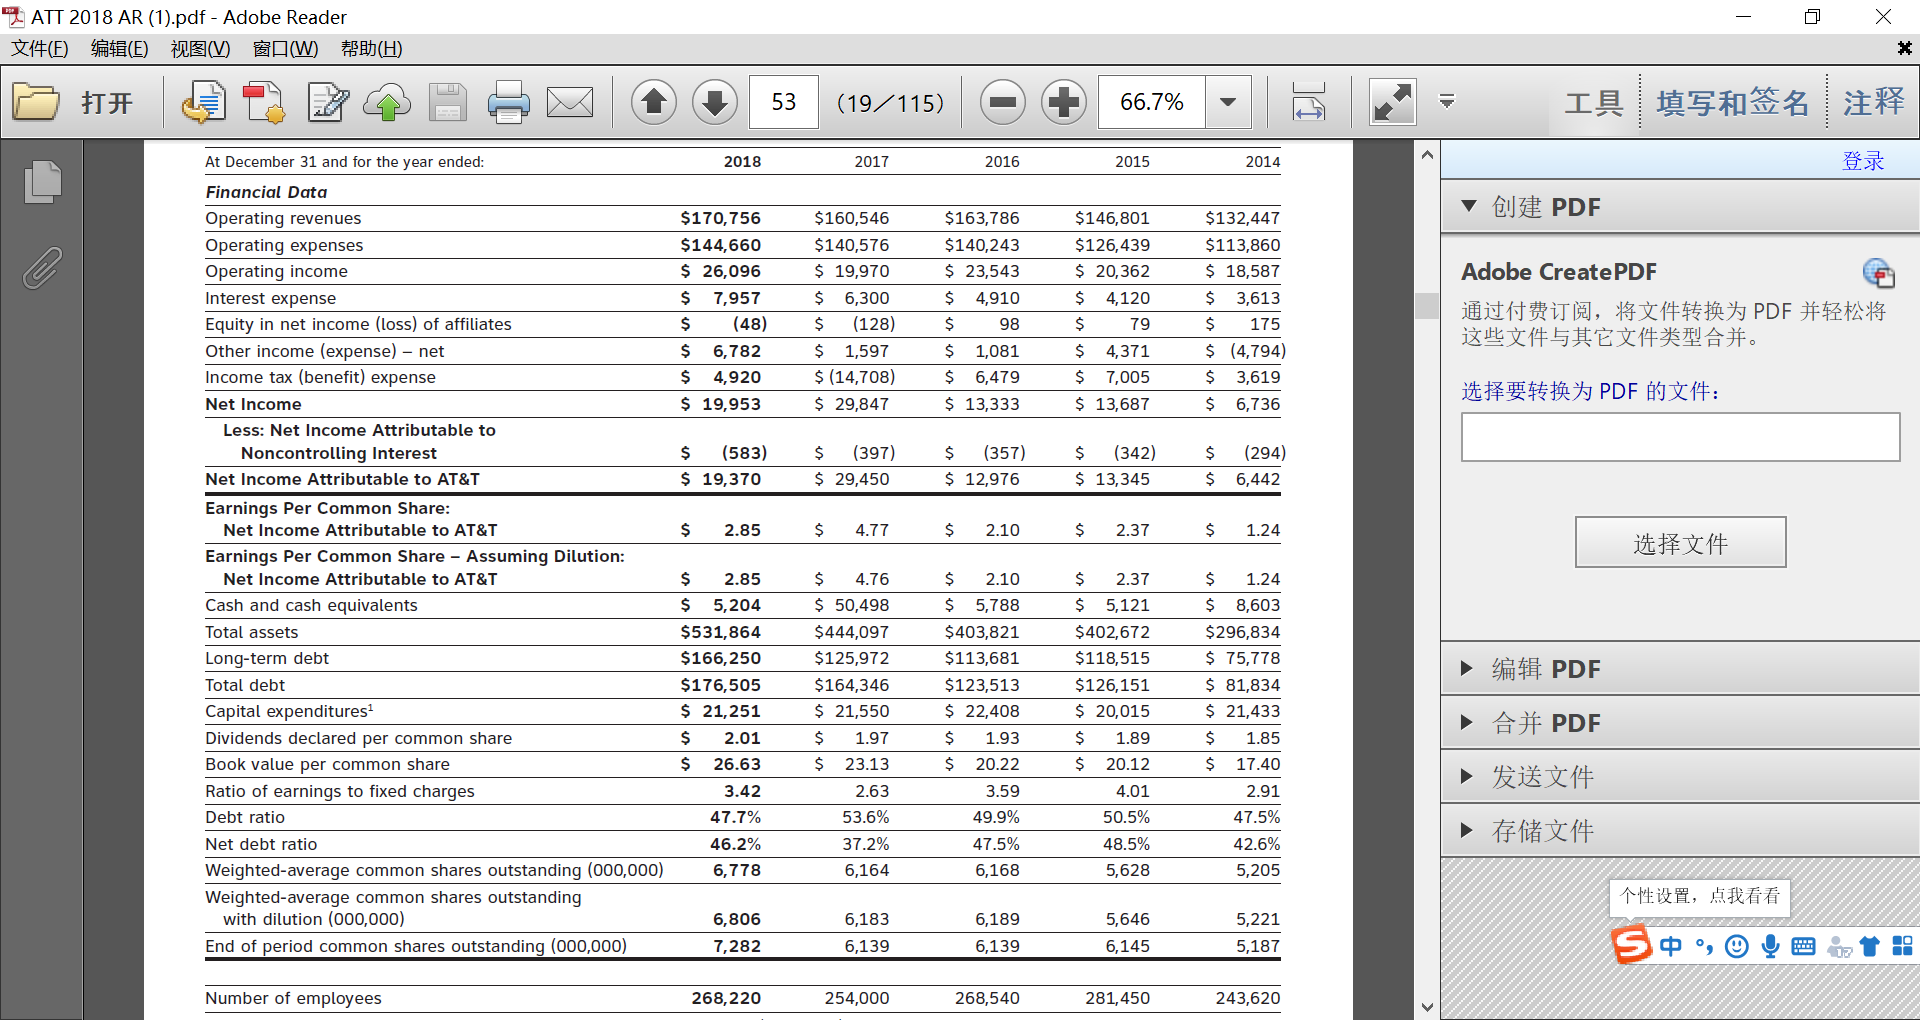
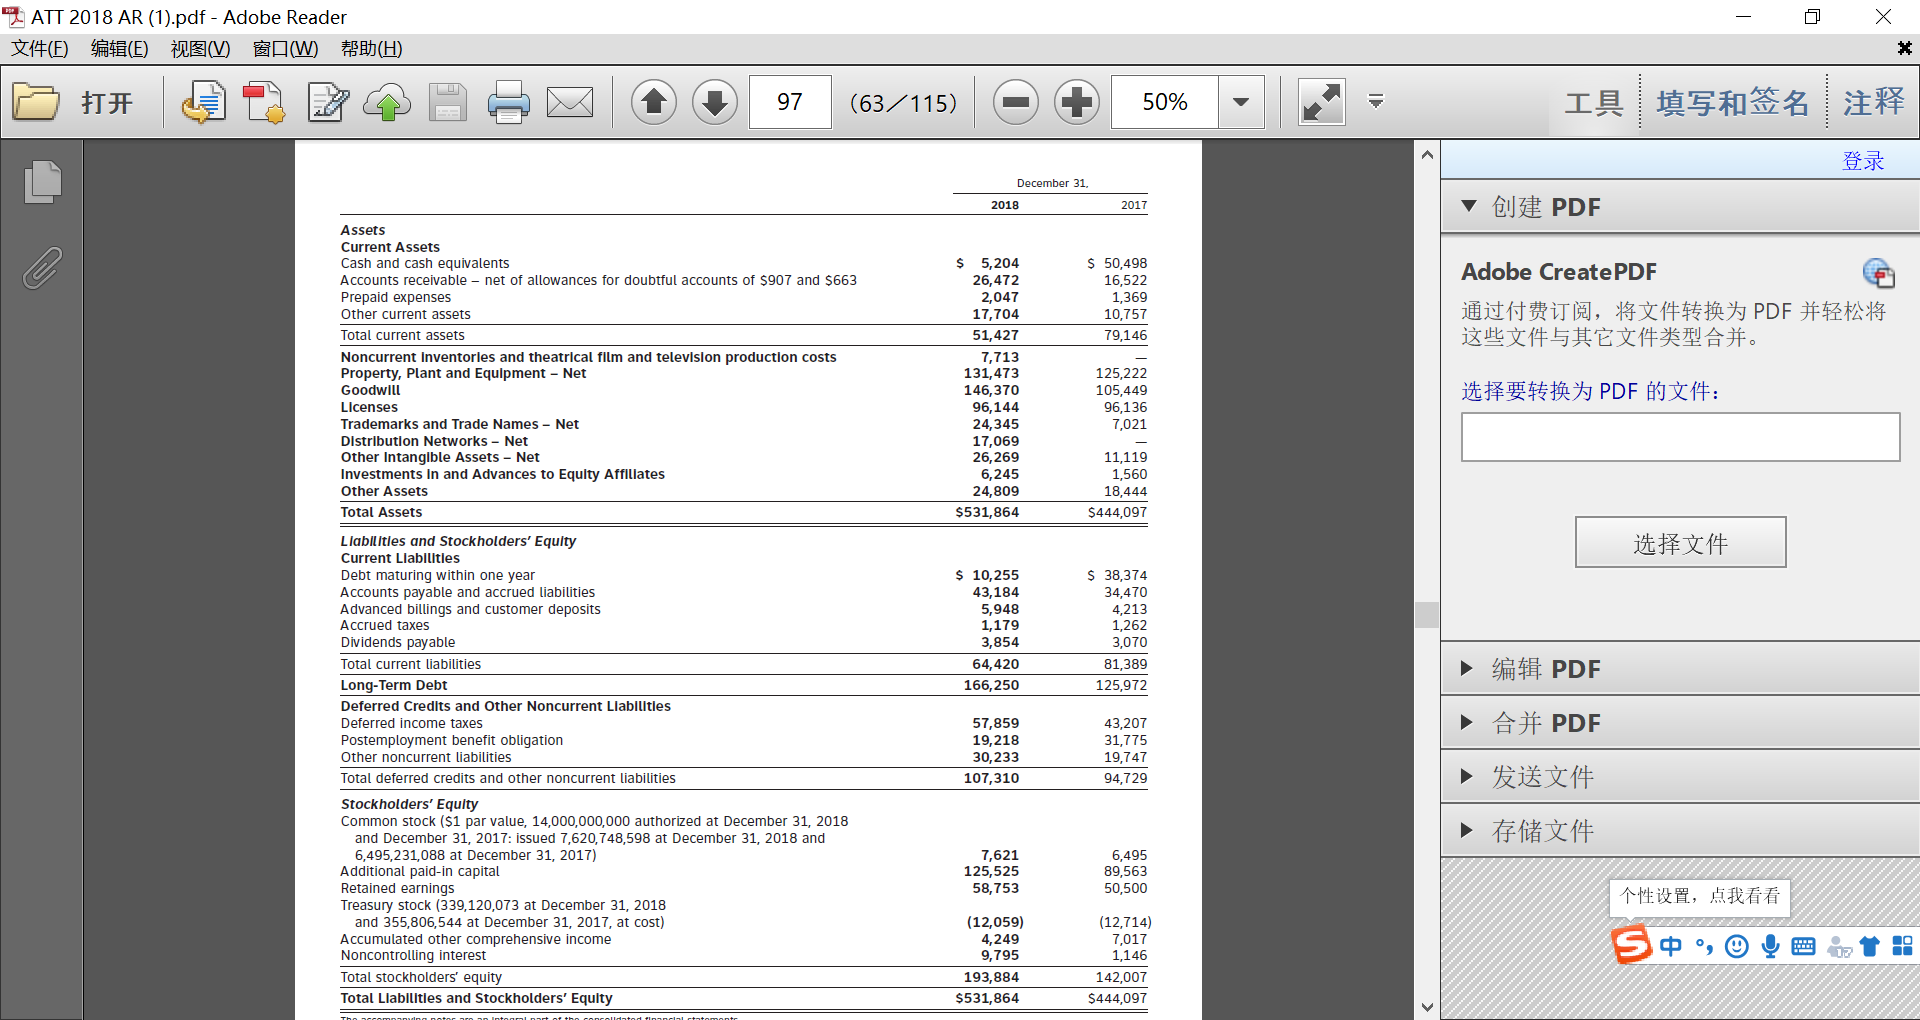
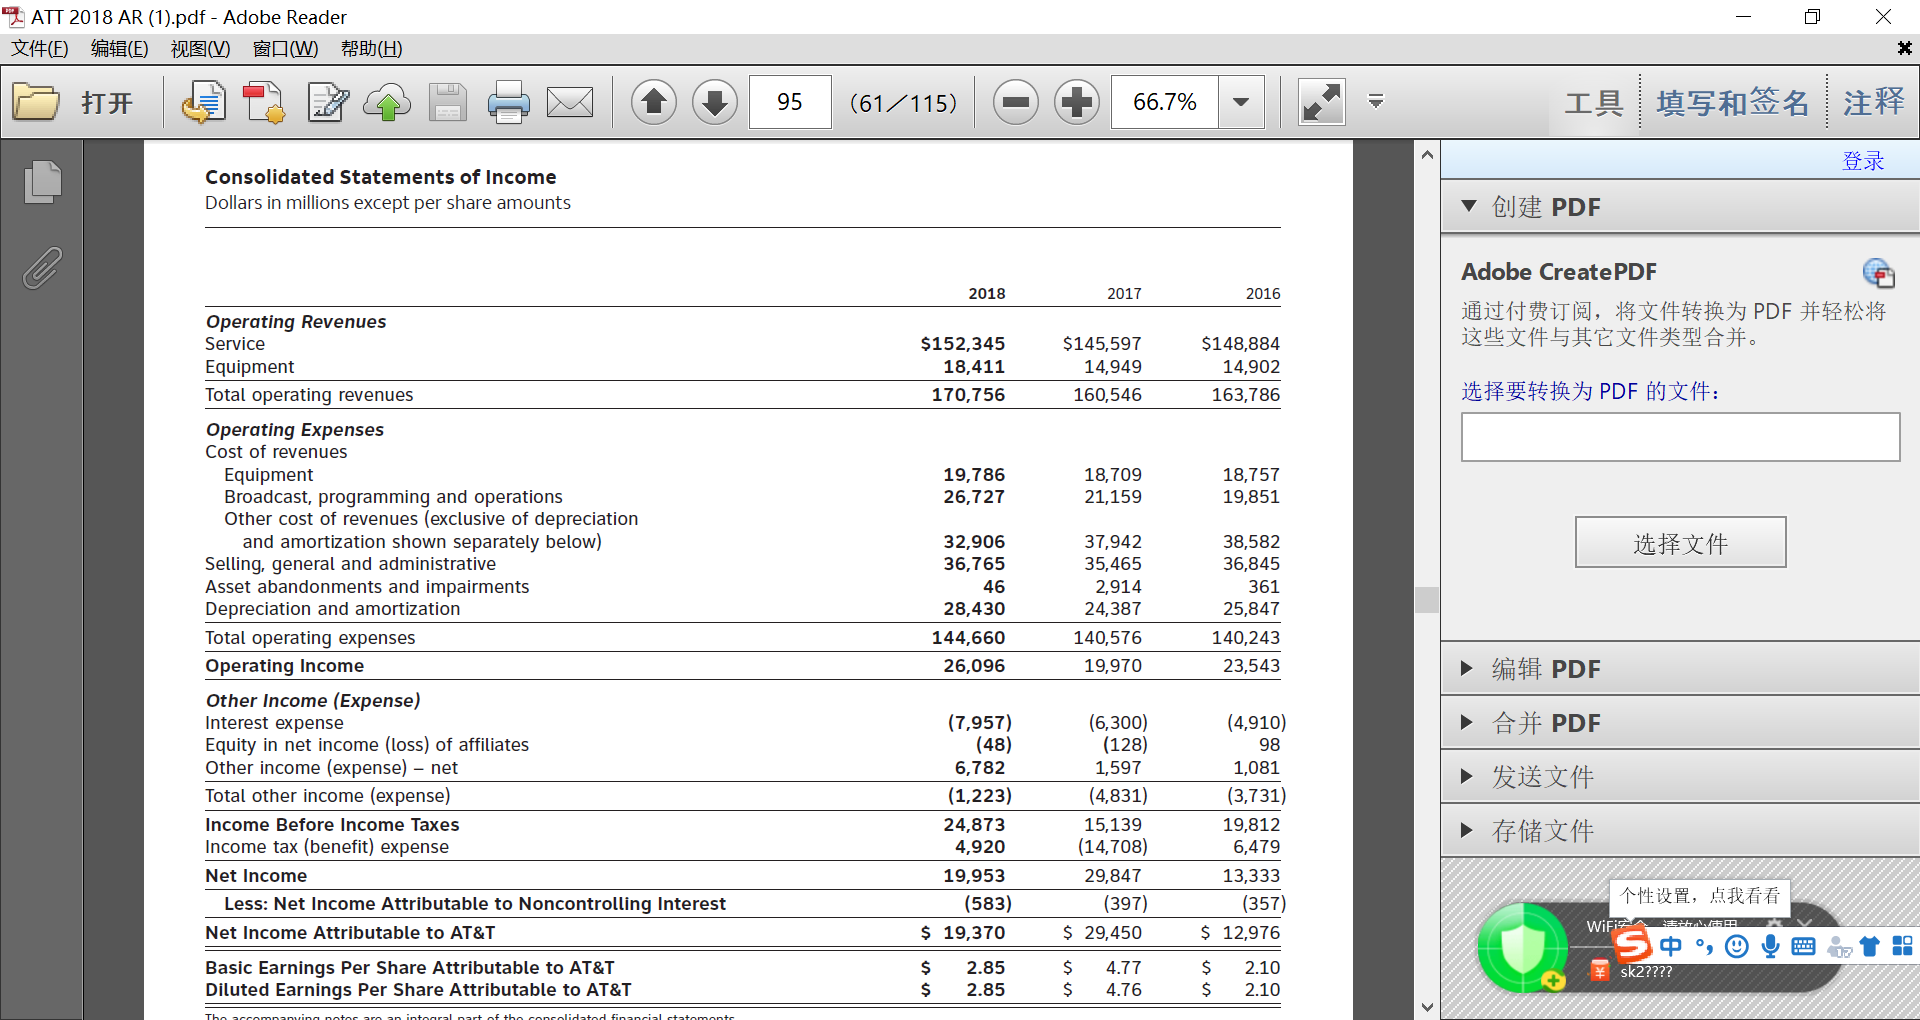
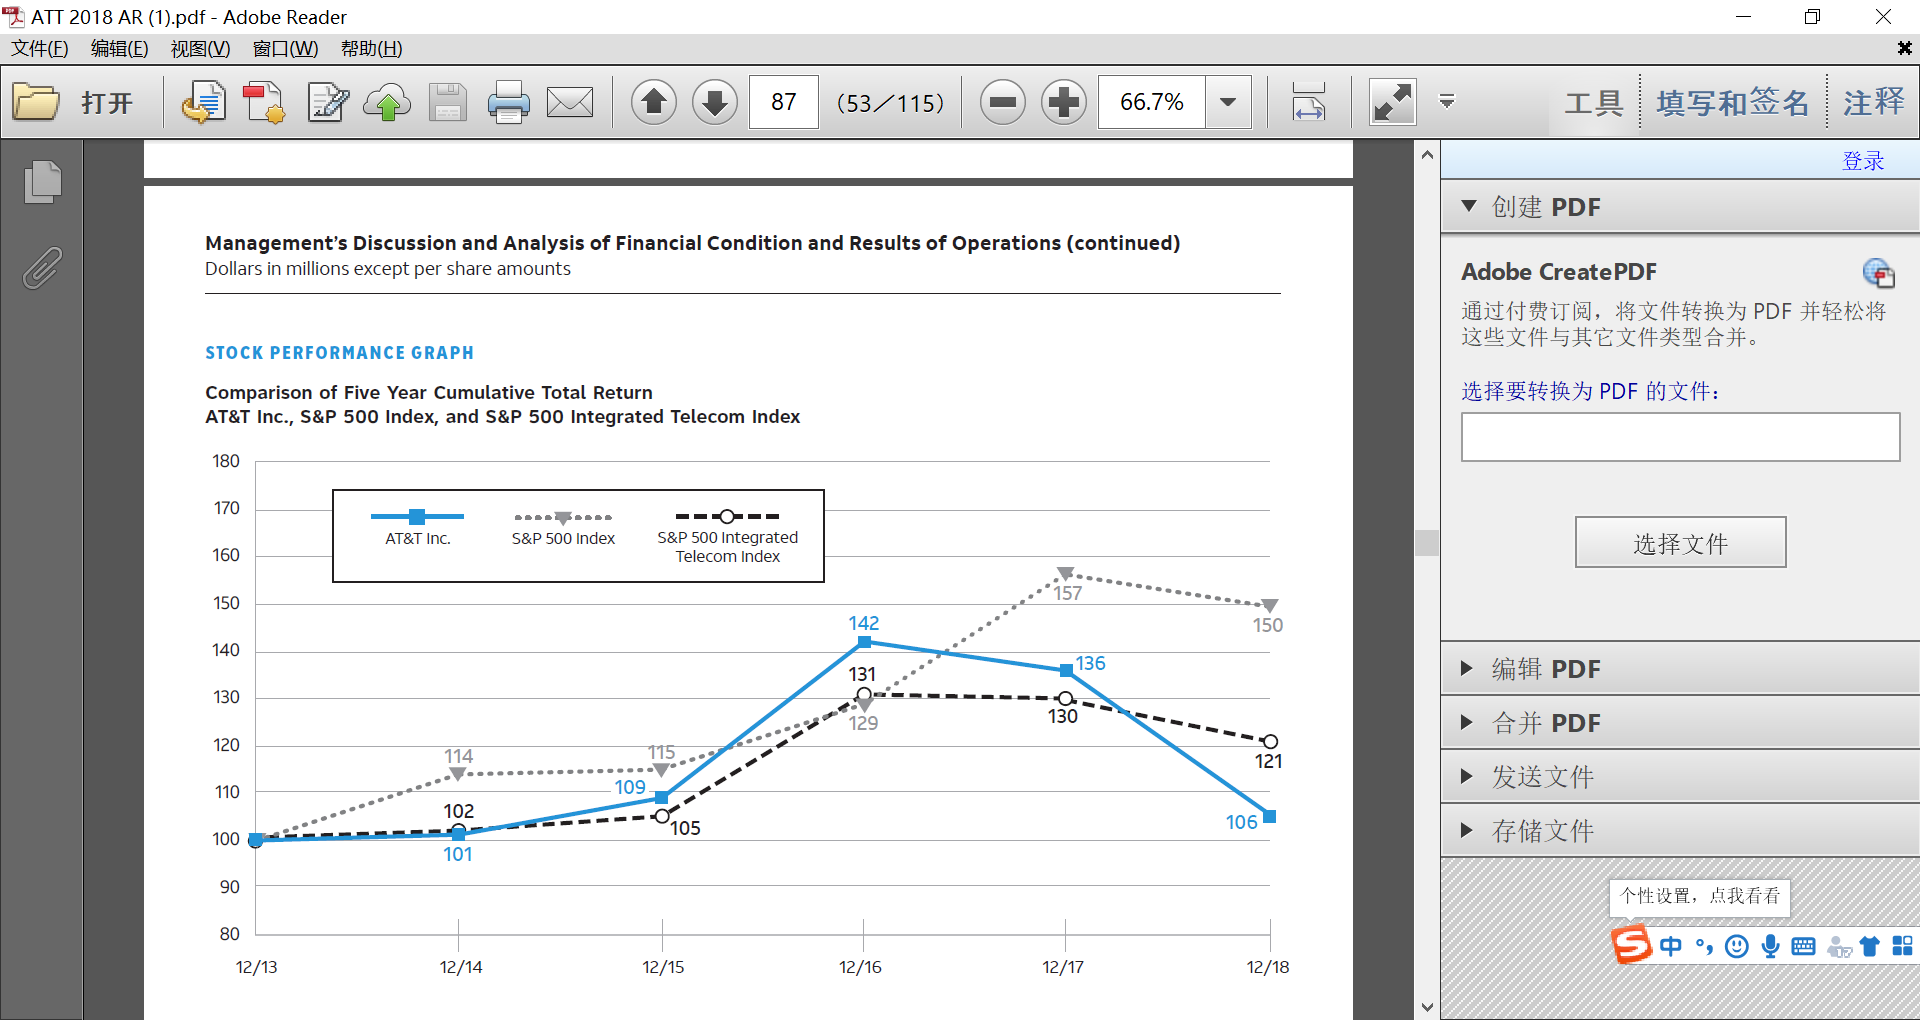
- X ATT 2018 AR (1).pdf - Adobe Reader 1(E) (E) NIVAW) (H) HH 2 97 (63/115) O + 50% 50% - = IV E * December 31. 2018 2017 PDF Adobe Create PDF $ 50,498 16,522 1,369 10,757 79,146 ,PDF Assets Current Assets Cash and cash equivalents Accounts receivable - net of allowances for doubtful accounts of $907 and $663 Prepaid expenses Other current assets Total current assets Noncurrent Inventories and theatrical film and television production costs Property, Plant and Equipment - Net Goodwill Licenses Trademarks and Trade Names - Net Distribution Networks - Net Other Intangible Assets - Net Investments in and Advances to Equity Affiliates Other Assets Total Assets $ 5,204 26,472 2,047 17,704 51,427 7,713 131,473 146,370 96,144 24,345 17,069 26,269 6,245 24,809 $531,864 125,222 105,449 96,136 7,021 5 PDF H 19: 11,119 1,560 18,444 $444,097 til Llabilities and Stockholders' Equity Current Liabilities Debt maturing within one year Accounts payable and accrued liabilities Advanced billings and customer deposits Accrued taxes Dividends payable Total current liabilities Long-Term Debt Deferred Credits and Other Noncurrent Liabilities Deferred income taxes Postemployment benefit obligation Other noncurrent liabilities Total deferred credits and other noncurrent liabilities $ 10,255 43,184 5,948 1,179 3,854 64,420 166,250 $ 38,374 34,470 4,213 1,262 3,070 81,389 125,972 PDF PDF 57,859 19,218 30,233 107,310 43,207 31,775 19,747 94,729 ET E #like 14 7,621 125,525 58,753 6,495 89,563 50,500 Stockholders' Equity Common stock ($1 par value, 14,000,000,000 authorized at December 31, 2018 and December 31, 2017: issued 7,620,748,598 at December 31, 2018 and 6,495,231,088 at December 31, 2017) Additional paid-in capital Retained earnings Treasury stock (339,120,073 at December 31, 2018 and 355,806,544 at December 31, 2017, at cost) Accumulated other comprehensive income Noncontrolling interest Total stockholders' equity Total Liabilities and Stockholders' Equity , (12,059) 4,249 9,795 193,884 $531,864 (12,714) 7,017 1,146 142,007 $444,097 S 2 1 : - X ATT 2018 AR (1).pdf - Adobe Reader 1(E) (E) NIVAW) (H) # 2 20 BBM 95 (61/115) O + 66.7% 66.7% - = * Consolidated Statements of Income Dollars in millions except per share amounts PDF Adobe Create PDF 2018 2017 2016 ,PDF Operating Revenues Service Equipment Total operating revenues $152,345 18,411 170,756 $145,597 14,949 160,546 $148,884 14,902 163,786 5 PDF H 19: 19,786 26,727 18,709 21,159 18,757 19,851 til Operating Expenses Cost of revenues Equipment Broadcast, programming and operations Other cost of revenues (exclusive of depreciation and amortization shown separately below) Selling, general and administrative Asset abandonments and impairments Depreciation and amortization Total operating expenses Operating Income Other Income (Expense) Interest expense Equity in net income (Loss) of affiliates Other income (expense) - net Total other income (expense) Income Before Income Taxes Income tax (benefit) expense Net Income Less: Net Income Attributable to Noncontrolling Interest 32,906 36,765 46 28,430 144,660 26,096 37,942 35,465 2,914 24,387 140,576 19,970 38,582 36,845 361 25,847 140,243 23,543 PDF (4,910) PDF 98 ET E (7,957) (48) 6,782 (1,223) 24,873 4,920 19,953 (583) $ 19,370 F l 3 14 (6,300) (128) 1,597 (4,831) 15,139 (14,708) 29,847 (397) $ 29,450 $ 4.77 $ 4.76 1,081 (3,731) 19,812 6,479 13,333 (357) $ 12,976 , WiFi t ball Net Income Attributable to AT&T S 8 T : Basic Earnings Per Share Attributable to AT&T Diluted Earnings Per Share Attributable to AT&T $ $ 2.85 2.85 $ $ 2.10 2.10 * sk2???? The accomanwing notes are an integral part of the consolidated financial statemente - x ATT 2018 AR (1).pdf - Adobe Reader (E) (E) (V) W (H) pp . 87 (53/115) - + 66.7% - : PDF Management's Discussion and Analysis of Financial Condition and Results of Operations (continued) Dollars in millions except per share amounts Adobe Create PDF ,PDF STOCK PERFORMANCE GRAPH PDF : Comparison of Five Year Cumulative Total Return AT&T Inc., S&P 500 Index, and S&P 500 Integrated Telecom Index 180 170 AT&T Inc. S&P 500 Index -- -- S&P 500 Integrated Telecom Index 160 60 140 136 > PDF 130 130 PDF 120 114 110 102 109. ---105 106 A00 101 , | 12/13 12/14 12/5 5, ger 12/15 12/6 12/16 12/ 12/17 12/18 12/18