Question
Based on the model results, particularly the coefficients and p-values, write a short paragraph to explain to the Board of Directors of the Insurance company
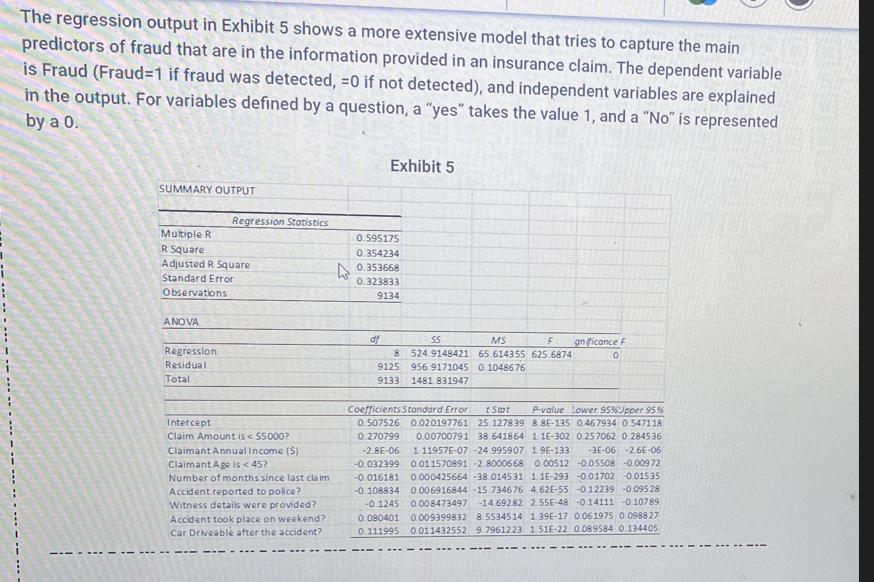
Based on the model results, particularly the coefficients and p-values, write a short paragraph to explain to the Board of Directors of the Insurance company what are the characteristics of a claim that make it more likely to involve fraud.2. You want to interpret the coefficient of Annual Income in this model. Most incomes in the data range between $100,000 per year and $200,000 per year. Report the difference in probability of fraud for someone earning $200,000 compared with $100,000.3. Suppose you are comparing two claims, Claim A and Claim B.Claim A: is from a 30 year-old, the accident was reported to police, witness details were provided, and the accident took place on a weekday.Claim B: is from a 50 year-old, the accident was not reported to police, witness details were not provided, and the accident took place on a weekend.Assume other characteristics of the two claims are the same. Calculate the difference in the probability of fraud between these two claims to 2 decimal places. Make sure to show your working.4. The R-Square value in this model is 0.354. Explain what this value is measuring, its range, and comment on what we learn from it in this model.5. In Section D (Exhibit 4) we were modelling the same dependent variable, but had only one independent variable, "Driveable". The R-Square in that case was 0.006. Explain the reason for the difference between the R-Square values in SectionD and SectionE. 
The regression output in Exhibit 5 shows a more extensive model that tries to capture the main predictors of fraud that are in the information provided in an insurance claim. The dependent variable is Fraud (Fraud-1 if fraud was detected, =0 if not detected), and independent variables are explained in the output. For variables defined by a question, a "yes" takes the value 1, and a "No" is represented by a 0. SUMMARY OUTPUT Exhibit 5 Regression Statistics Multiple R 0.595175 R Square 0.354234 Adjusted R Square Standard Error Observations 0.353668 0.323833 9134 ANOVA Regression Residual Total Intercept Claim Amount is < $5000? Claimant Annual Income (S) Claimant Age is < 457 Number of months since last claim Accident reported to police? Witness details were provided? Accident took place on weekend? Car Driveable after the accident? of SS 8 524 9148421 9125 956 9171045 9133 1481 831947 Coefficients Standard Error 0.507526 0.270799 -2.8E-06 -0.032399 -0.016181 -0.108834 -0.1245 0.080401 0.111995 MS F gnificance F 65.614355 625.6874 0.1048676 Stot P-value Lower 95% Upper 95% 0.020197761 25 127839 8.8E-135 0.467934 0.547118 0.00700791 38.641864 1 1E-302 0.257062 0.284536) 111957E-07-24 995907 1.9E-133 -3E-06 2.6E-06 0.011570891 -2.8000668 0.00512 -0.05508 -0.00972 0.000425664 -38.014531 1.1E-293 -0.01702 -0.01535 0006916844 15 734676 4.62E-55 -0.12239 -0.09528 0.008473497 -14.69282 2.55E-48 -0.14111 -0.10789 0.009399832 8 5534514 1.39E-17 0.061975 0.098827 0.011432552 9.7961223 1.51E-22 0.089584 0 134405
Step by Step Solution
There are 3 Steps involved in it
Step: 1
Certainly lets address each of your points in turn 1 Characteristics of Claims Involving Fraud Based on the statistical analysis certain characteristics increase the likelihood of a claim involving fr...
Get Instant Access to Expert-Tailored Solutions
See step-by-step solutions with expert insights and AI powered tools for academic success
Step: 2

Step: 3

Ace Your Homework with AI
Get the answers you need in no time with our AI-driven, step-by-step assistance
Get Started


