

Question
Based on the multiples for comparable regulated utilities, what is the range of possible values for PacifiCorp? Tips: We can use time value of money
Based on the multiples for comparable regulated utilities, what is the range of possible values for PacifiCorp?
Tips:
We can use time value of money concepts to determine growth rates. For example, if Sales five years ago totaled $3 million and the most current Sales figure is $5 million, then sales grew at a 10.76% rate. The data inputs are: PV = -3; FV = 5; PMT = 0; n = 5 and solve for i.
The dividend discount model is used to find an estimate of a stocks value, or its valuation. It is one of the most widely used methods of stock valuation. The formula is given by D1/(k-g) where D1 is the next expected annual dividend, k is the required return from CAPM and g is the expected growth rate.
Another widely used method to value a firms stock is market multiples. There are several market multiples that can be used: P/E, P/S, P/CF and M/B. P/E or the price-earnings multiple is the most common. P/S is price-to-sales which is favored by investors that realize that sales is much more difficult to window dress than earnings. P/CF is price-to-cash flow and is favored by investors that prefer to use cash flow rather than net income (earnings). Net income doesnt pay the bills, cash does. M/B or price-to-book is used in a few select cases.
Example: If XYZ expected EPS is $3.00 and the P/E of the industry average is 15x. We can use this data to obtain an estimate of what XYZ is worth. P/E x EPS = 15 x 3 = 45. The interpretation is that if the firm is trading at the industry average P/E, then it is worth $45 per share. Note that in all cases, you are using the firms EPS or sales per share or cash flow per share or book value per share. The P/E or P/S or P/CF or M/B ratio, in other words, market multiple, is something other than what the firm is currently trading at.
PreviousNext
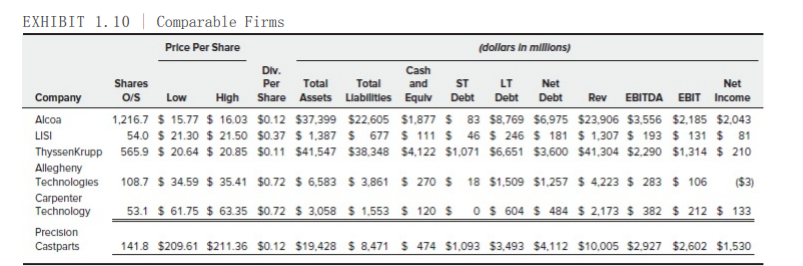
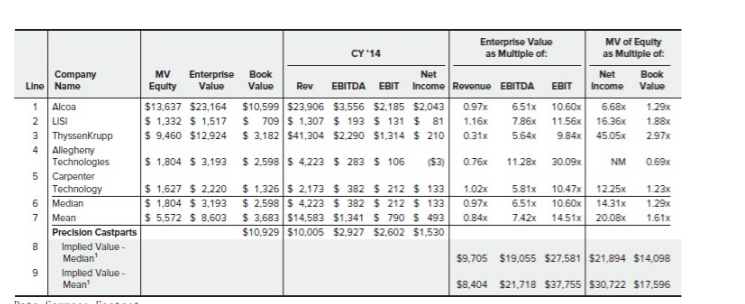
EXHIBIT 1.10 Comparable Firms Price Per Share (dollars in millions) Div. Cash Shares Per Total Total and ST LT Net Net Company O/S Low High Share Assets Liabilities Equlv Debt Debt Debt Rev EBITDA EBIT Income Alcoa 1,216.7 $ 15.77 $ 16.03 $0.12 $37,399 $22,605 $1,877 $ 83 $8,769 $6,975 $23,906 $3,556 $2,185 $2,043 54.0 $ 21.30 $ 21.50 $0.37 $ 1,387 $ 677 $ 111 $ 45 $ 246 $ 181 $ 1,307 $ 193 $ 131 $ 81 ThyssenKrupp 565.9 $ 20.64 $ 20.85 $0.11 $41,547 538,348 54,122 $1,071 $6,651 $3,600 $41,304 $2,290 $1,314 $ 210 Allegheny Technologies 108.7 $ 34.59 $ 35.41 $0.72 $ 6,583 $ 3.861 $ 270 $ 18 $1,509 $1,257 $ 4,223 $ 283 $ 106 ($3) Carpenter Technology 53.1 $ 61.75 $ 63.35 $0.72 $ 3,058 $ 1.553 $ 120 $0 $ 604 $ 484 $ 2.173 $ 382 $ 212 $ 133 Precision Castparts 141.8 $209.61 $211.36 $0.12 $19.428 $ 8.471 $ 474 $1.093 $3.493 $4.112 $10,005 $2.927 $2,602 $1.530 LISI WN Enterprise Value MV of Equity CY '14 as Multiple of: as Multiple of: Company MV Enterprise Book Net Net Book Line Name Equity Value Value Rev EBITDA EBIT Income Revenue EBITDA EBIT Income Value 1 Alcoa $13,637 $23,164 $10,599 $23,906 $3,556 $2,185 $2,043 0.97x 6.51x 10.60% 6.68% 1.29% LISI $ 1,332 $ 1.517 $ 709 $ 1,307 $ 193 $ 131 $ 81 1.16x 7.86 11.56x 16.36x 1.88x 3 ThyssenKrupp $ 9,460 $12,924 $ 3,182 $41,304 $2.290 $1,314 $ 210 0.31x 5.64x 9.84x 45.05% 2.97x 4 Allegheny Technologies $ 1.804 $ 3,193 $ 2,598 $ 4.223 $ 283 $ 106 (53) 0.76x 11.28x 30.09x NM 0.69x 5 Carpenter Technology S 1.627 $ 2.220 $ 1,326 $ 2,173 $ 382 $ 212 $ 133 1.02x 5.81x 10.47x 12.25 1.23x 6 Median $ 1.804 $ 3.193 $ 2,598 $ 4,223 $ 382 $ 212 $ 133 0.97 6.51x 10.60 14.31x 1.29% 7 Mean $ 5,572 $ 8,603 $ 3,683 $14,583 $1,341 $ 790 $ 493 0.84x 7.42x 14.51x 20.08x 1.61x Precision Castparts $10,929 $10,005 $2.927 $2,602 $1,530 8 Implied Value Median $9.705 $19,055 $27,581 $21,894 $14,098 9 Implied Value - Mean! $8.404 $21,718 $37,755 $30.722 $17.596 EXHIBIT 1.10 Comparable Firms Price Per Share (dollars in millions) Div. Cash Shares Per Total Total and ST LT Net Net Company O/S Low High Share Assets Liabilities Equlv Debt Debt Debt Rev EBITDA EBIT Income Alcoa 1,216.7 $ 15.77 $ 16.03 $0.12 $37,399 $22,605 $1,877 $ 83 $8,769 $6,975 $23,906 $3,556 $2,185 $2,043 54.0 $ 21.30 $ 21.50 $0.37 $ 1,387 $ 677 $ 111 $ 45 $ 246 $ 181 $ 1,307 $ 193 $ 131 $ 81 ThyssenKrupp 565.9 $ 20.64 $ 20.85 $0.11 $41,547 538,348 54,122 $1,071 $6,651 $3,600 $41,304 $2,290 $1,314 $ 210 Allegheny Technologies 108.7 $ 34.59 $ 35.41 $0.72 $ 6,583 $ 3.861 $ 270 $ 18 $1,509 $1,257 $ 4,223 $ 283 $ 106 ($3) Carpenter Technology 53.1 $ 61.75 $ 63.35 $0.72 $ 3,058 $ 1.553 $ 120 $0 $ 604 $ 484 $ 2.173 $ 382 $ 212 $ 133 Precision Castparts 141.8 $209.61 $211.36 $0.12 $19.428 $ 8.471 $ 474 $1.093 $3.493 $4.112 $10,005 $2.927 $2,602 $1.530 LISI WN Enterprise Value MV of Equity CY '14 as Multiple of: as Multiple of: Company MV Enterprise Book Net Net Book Line Name Equity Value Value Rev EBITDA EBIT Income Revenue EBITDA EBIT Income Value 1 Alcoa $13,637 $23,164 $10,599 $23,906 $3,556 $2,185 $2,043 0.97x 6.51x 10.60% 6.68% 1.29% LISI $ 1,332 $ 1.517 $ 709 $ 1,307 $ 193 $ 131 $ 81 1.16x 7.86 11.56x 16.36x 1.88x 3 ThyssenKrupp $ 9,460 $12,924 $ 3,182 $41,304 $2.290 $1,314 $ 210 0.31x 5.64x 9.84x 45.05% 2.97x 4 Allegheny Technologies $ 1.804 $ 3,193 $ 2,598 $ 4.223 $ 283 $ 106 (53) 0.76x 11.28x 30.09x NM 0.69x 5 Carpenter Technology S 1.627 $ 2.220 $ 1,326 $ 2,173 $ 382 $ 212 $ 133 1.02x 5.81x 10.47x 12.25 1.23x 6 Median $ 1.804 $ 3.193 $ 2,598 $ 4,223 $ 382 $ 212 $ 133 0.97 6.51x 10.60 14.31x 1.29% 7 Mean $ 5,572 $ 8,603 $ 3,683 $14,583 $1,341 $ 790 $ 493 0.84x 7.42x 14.51x 20.08x 1.61x Precision Castparts $10,929 $10,005 $2.927 $2,602 $1,530 8 Implied Value Median $9.705 $19,055 $27,581 $21,894 $14,098 9 Implied Value - Mean! $8.404 $21,718 $37,755 $30.722 $17.596Step by Step Solution
There are 3 Steps involved in it
Step: 1

Get Instant Access to Expert-Tailored Solutions
See step-by-step solutions with expert insights and AI powered tools for academic success
Step: 2

Step: 3
Ace Your Homework with AI
Get the answers you need in no time with our AI-driven, step-by-step assistance
Get Started
Financial Management Core Concepts
Authors: Raymond M Brooks
3rd edition
133866696, 978-0133866698